
Photo Credit: Ursula Page / Shutterstock
One of the major economic stories in recent months has been rising concerns about inflation. While year-over-year wage growth in the U.S. has reached its fastest rate in decades this year, the benefit of rising wages for most households has been limited by increasing prices in many consumer categories. The U.S. Bureau of Labor Statistics has been reporting price increases in excess of 5–6%, figures well above typical levels. Recent increases in the CPI primarily came from increases in the cost of energy, transportation, food, and shelter.
The latter category tends to be a major pressure on household incomes. Housing is the largest regular expenditure for most households, so the failure of wages to keep up with housing prices can make housing costs even more expensive in real dollars. And over the last year and a half, housing prices have skyrocketed, with the cost of homes sold in the U.S. increasing by more than 18% over the last year.
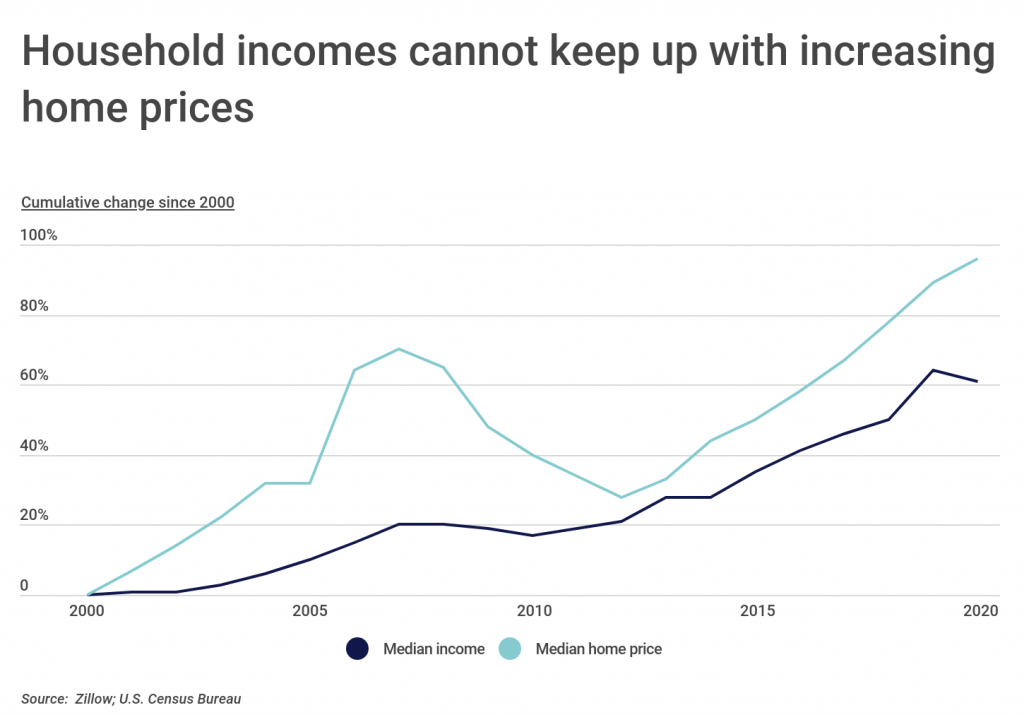
While recent economic conditions have caused greater alarm, the gap between the rates of growth for incomes and home prices is not a new phenomenon. The rate of growth of median income has lagged behind that of home prices for at least the last two decades. From 2000 to 2020, the median income in the U.S. increased by 61%, from $41,990 to $67,521, while the median home price nearly doubled—a 96% increase—from $127,569 to $249,497, according to data from the U.S. Census Bureau and Zillow.
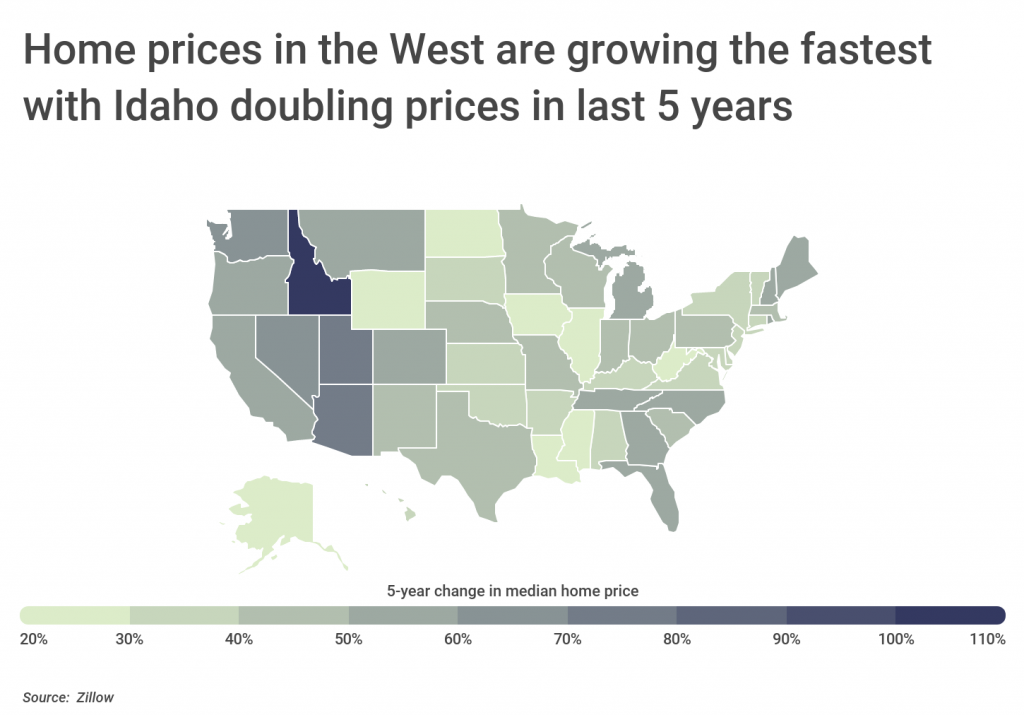
The gap between wage growth and home price growth may be most severely felt in areas where home prices are increasing the fastest. States in the West have shown the most rapid increases in housing costs in recent years, led by Idaho, where the median home price is up by 110% just over the last five years. Other fast-growing Western states like Utah, Arizona, Washington, and Nevada have also seen rapid home price increases over that span.
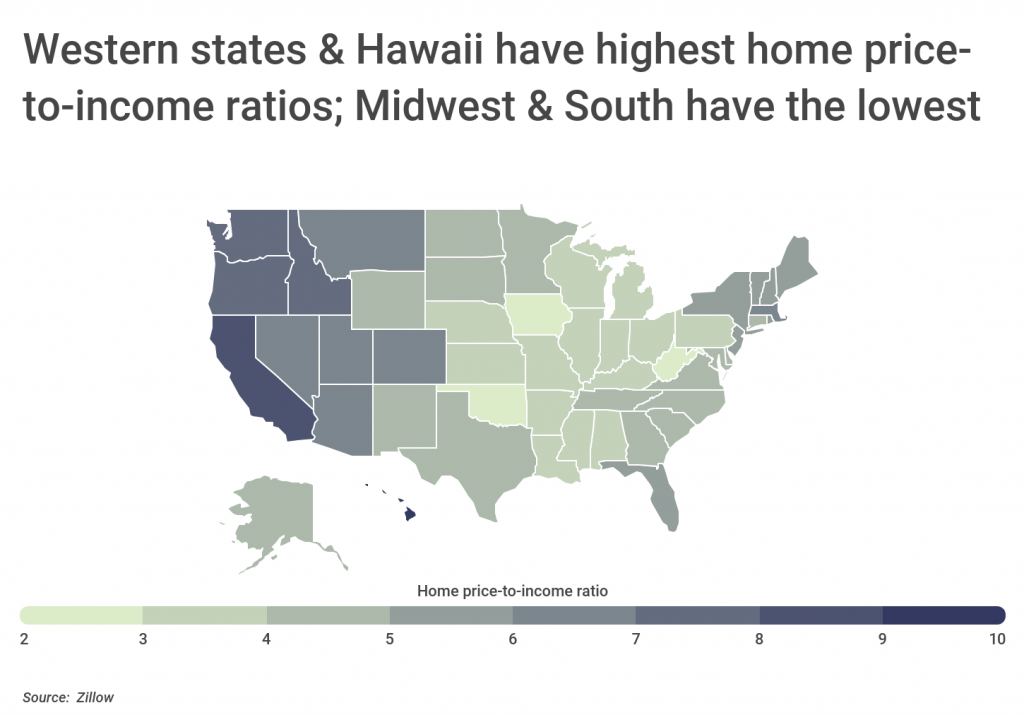
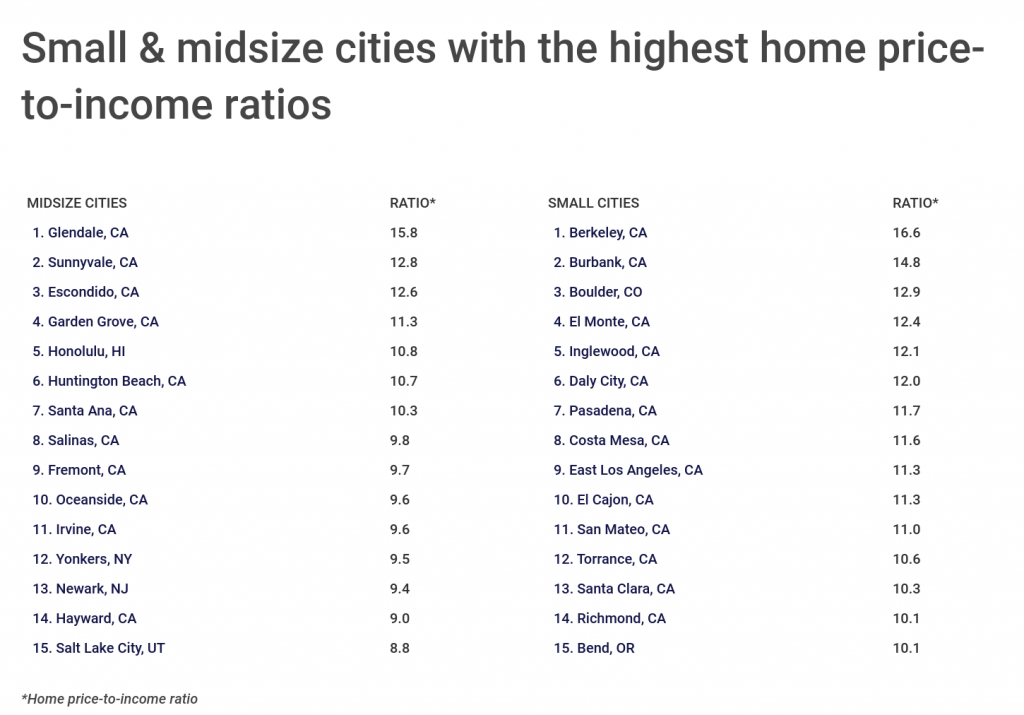
Many of these Western states are now among the national leaders in home price-to-income ratio. The ratio of median home price to median income is one indicator for housing affordability. Nationally, that ratio is 4.7, but the top 10 states—nine of which are found in the West—currently have ratios of 6.3 or greater. The top states are Hawaii (9.4) and California (8.9), two of the states with the highest home prices and long-running issues with affordable housing. And at the local level, some California metros exhibit even starker ratios, with the top five most expensive large metros in the U.S. all being located in the Golden State.
Data on household income and spending are from the U.S. Census Bureau and median home values are from Zillow. To identify cities with the highest and lowest home price-to-income ratios, researchers at Construction Coverage divided the Zillow Home Value Index by median household income in each location. Researchers also calculated the five-year change in home price.
Here are the U.S. cities with the highest price-to-income ratios.
Large Cities With the Highest Home Price-to-Income Ratios

Photo Credit: Jon Bilous / Shutterstock
15. Portland, OR
- Home price-to-income ratio: 7.3
- Median home price: $558,685
- Median household income: $76,231
- 5-year change in median home price: +32.0%
- Mortgage holders spending >30% of income on housing: 29.7%

Photo Credit: Nicholas Courtney / Shutterstock
14. Denver, CO
- Home price-to-income ratio: 7.5
- Median home price: $568,178
- Median household income: $75,646
- 5-year change in median home price: +47.3%
- Mortgage holders spending >30% of income on housing: 29.0%

Photo Credit: A G Baxter / Shutterstock
13. Washington, DC
- Home price-to-income ratio: 7.6
- Median home price: $698,414
- Median household income: $92,266
- 5-year change in median home price: +22.8%
- Mortgage holders spending >30% of income on housing: 25.2%

Photo Credit: Ryan Conine / Shutterstock
12. Austin, TX
- Home price-to-income ratio: 8.0
- Median home price: $601,313
- Median household income: $75,413
- 5-year change in median home price: +77.8%
- Mortgage holders spending >30% of income on housing: 27.9%

Photo Credit: Jeremy Janus / Shutterstock
11. Seattle, WA
- Home price-to-income ratio: 8.5
- Median home price: $875,450
- Median household income: $102,486
- 5-year change in median home price: +45.6%
- Mortgage holders spending >30% of income on housing: 25.9%

Photo Credit: Travellaggio / Shutterstock
10. Boston, MA
- Home price-to-income ratio: 8.8
- Median home price: $697,690
- Median household income: $79,018
- 5-year change in median home price: +26.9%
- Mortgage holders spending >30% of income on housing: 29.6%

Photo Credit: Sean Pavone / Shutterstock
9. San Diego, CA
- Home price-to-income ratio: 10.1
- Median home price: $864,662
- Median household income: $85,507
- 5-year change in median home price: +59.2%
- Mortgage holders spending >30% of income on housing: 35.7%

Photo Credit: Just dance / Shutterstock
8. Miami, FL
- Home price-to-income ratio: 10.1
- Median home price: $435,121
- Median household income: $42,966
- 5-year change in median home price: +29.2%
- Mortgage holders spending >30% of income on housing: 47.1%

Photo Credit: John Roman Images / Shutterstock
7. Anaheim, CA
- Home price-to-income ratio: 10.5
- Median home price: $796,098
- Median household income: $76,075
- 5-year change in median home price: +44.6%
- Mortgage holders spending >30% of income on housing: 39.5%

Photo Credit: Victor Moussa / Shutterstock
6. New York, NY
- Home price-to-income ratio: 10.5
- Median home price: $728,404
- Median household income: $69,407
- 5-year change in median home price: +21.4%
- Mortgage holders spending >30% of income on housing: 41.2%

Photo Credit: Ingus Kruklitis / Shutterstock
5. Long Beach, CA
- Home price-to-income ratio: 11.2
- Median home price: $761,094
- Median household income: $67,804
- 5-year change in median home price: +48.6%
- Mortgage holders spending >30% of income on housing: 40.4%
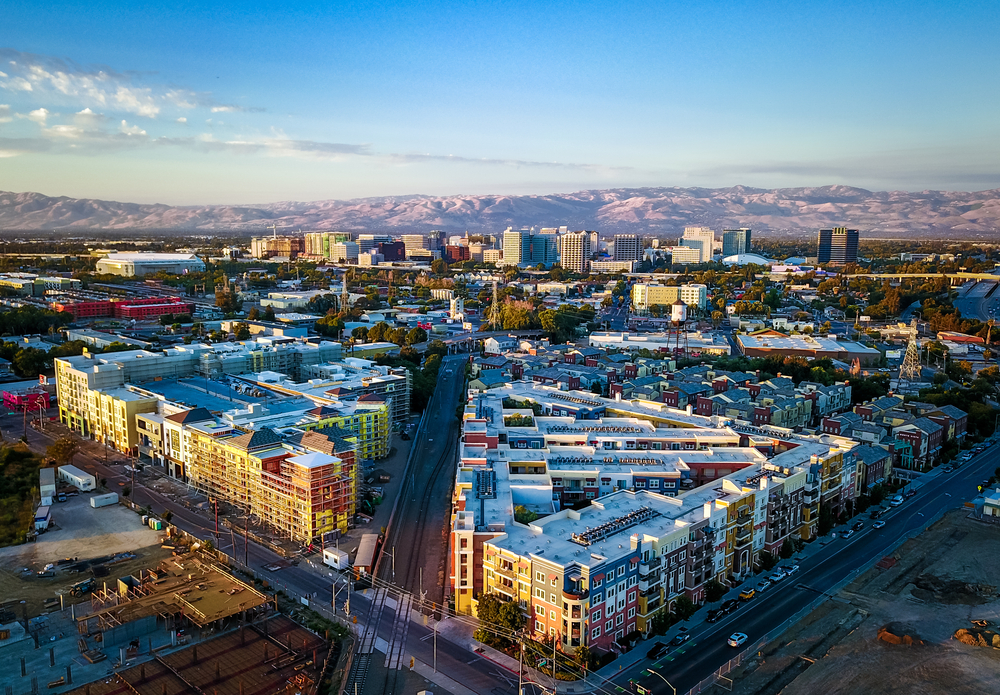
Photo Credit: Uladzik Kryhin / Shutterstock
4. San Jose, CA
- Home price-to-income ratio: 11.2
- Median home price: $1,303,422
- Median household income: $115,893
- 5-year change in median home price: +52.1%
- Mortgage holders spending >30% of income on housing: 31.9%

Photo Credit: yhelfman / Shutterstock
3. Oakland, CA
- Home price-to-income ratio: 11.6
- Median home price: $952,381
- Median household income: $82,018
- 5-year change in median home price: +51.7%
- Mortgage holders spending >30% of income on housing: 38.3%

Photo Credit: Bogdan Vacarciuc / Shutterstock
2. San Francisco, CA
- Home price-to-income ratio: 12.3
- Median home price: $1,522,827
- Median household income: $123,859
- 5-year change in median home price: +28.2%
- Mortgage holders spending >30% of income on housing: 37.2%

Photo Credit: Chones / Shutterstock
1. Los Angeles, CA
- Home price-to-income ratio: 13.6
- Median home price: $913,754
- Median household income: $67,418
- 5-year change in median home price: +49.1%
- Mortgage holders spending >30% of income on housing: 44.4%
Methodology & Detailed Findings
Data on household income and mortgage holders who spend more than 30% of their income on housing are from the U.S. Census Bureau American Community Survey. Data on median home values are from Zillow’s Zillow Home Value Index. To identify cities with the highest and lowest home price-to-income ratios, researchers divided the median home price by median household income in each location. Researchers also calculated the five-year change in home price. To improve relevance, only locations with at least 100,000 residents were included. Additionally, cities were grouped into cohorts based on population size: small (100,000–149,999), midsize (150,000–349,999), and large (350,000 or more).
