Photo Credit: Joe Hendrickson / Shutterstock
According to data from the U.S. Census Bureau, 20% of American households earn passive income either through dividends, interest, or rental properties. Among those households who do have passive income, the median amount is $4,200 per year. Passive income streams can be a large contributor to wealth creation, and higher-income households are more likely to have the means to invest in assets that provide it.
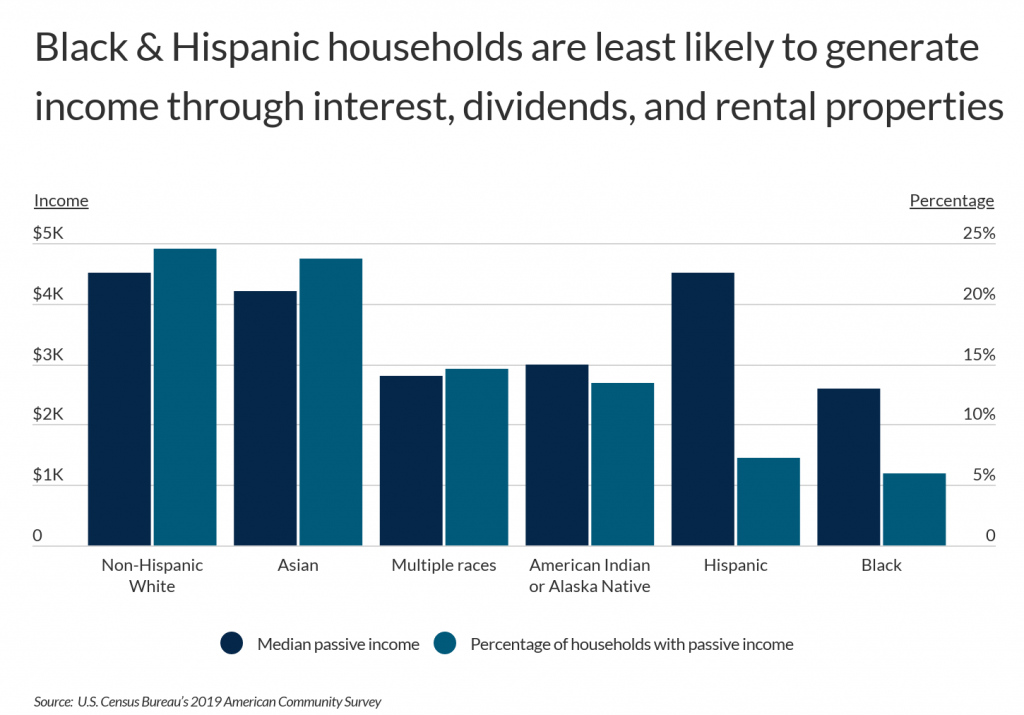
Disparities in passive income by race and ethnicity contribute to overall wealth disparities. Approximately 25% of non-Hispanic White households have passive income compared to just 7% of Hispanic households and 6% of Black households. Among those households with passive income, non-Hispanic White households tend to earn larger amounts of passive income as well—median passive income for this demographic group is $4,500. In addition to non-Hispanic Whites, Asians are also more likely than other racial groups to earn passive income.

The ability to earn passive income increases with total income, and passive income streams tend to make up a larger share of income for wealthier households. In fact, the wealthiest 10% of American households own 89% of all U.S. stocks, according to data from the Federal Reserve. Likewise, nearly 50% of the nation’s wealthiest households own residential property that is not their primary residence, compared to just 13% of all American households.
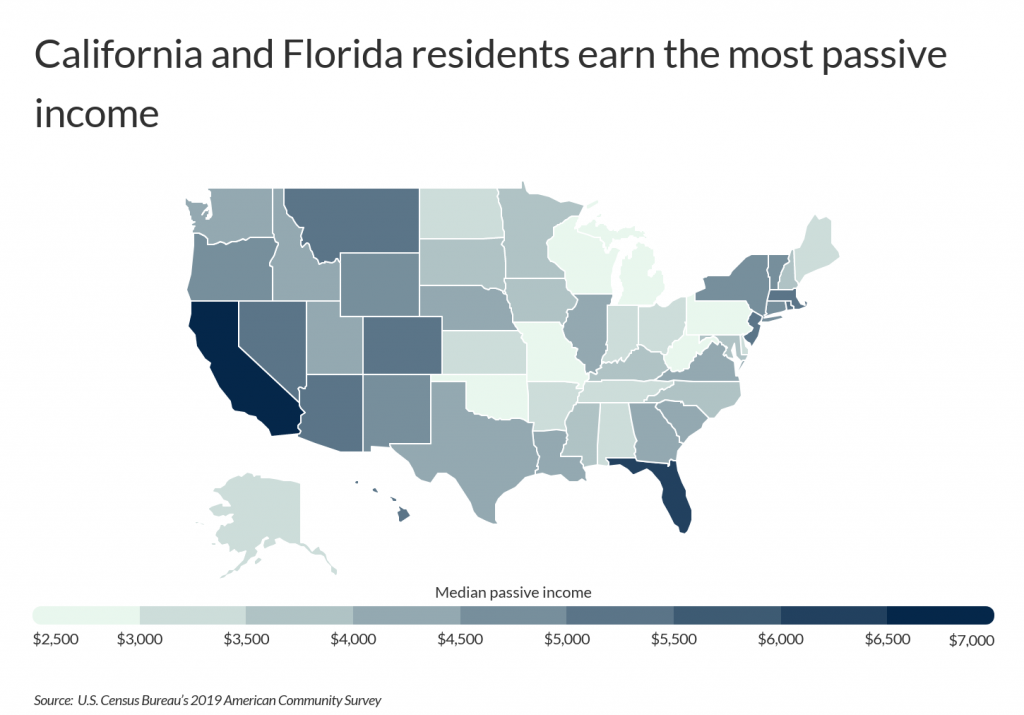
At the regional level, households on the West Coast, Northeast, and Florida tend to earn more passive income. These differences vary based on total household income and other demographic factors. California and Florida residents earn the most, with median passive income of $7,000 and $6,000 per year, respectively. Whereas California has one of the highest median total household incomes of any state, Florida is home to a larger share of retirees who tend to depend on passive income to cover their living expenses.

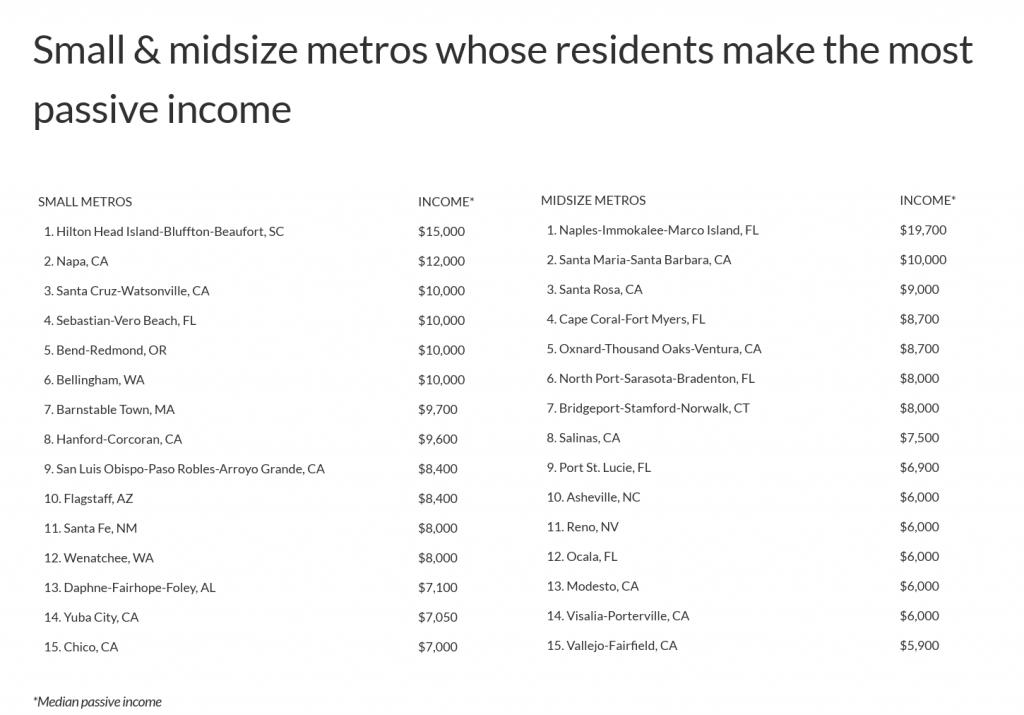
To determine the metropolitan areas whose residents make the most passive income, researchers at ChamberOfCommerce.org analyzed earnings and income data from the U.S. Census Bureau. Metro areas were ranked by median passive income among households who earn passive income. Researchers also calculated the percentage of households with passive income, median total household income, and the poverty rate.
Only metropolitan areas with at least 100,000 people were included in the analysis. Additionally, metro areas were grouped into the following cohorts based on population size:
- Small metros: 100,000–349,999
- Midsize metros: 350,000–999,999
- Large metros: 1,000,000 or more
Here are the metro areas whose residents earn the most passive income.

Large Metros Whose Residents Make the Most Passive Income

Photo Credit: The Speedy Butterfly / Shutterstock
15. Memphis, TN-MS-AR
- Median passive income: $5,000
- Percentage of households with passive income: 13.7%
- Median total household income: $54,500
- Poverty rate: 15.4%

Photo Credit: Richard Cavalleri / Shutterstock
14. Providence-Warwick, RI-MA
- Median passive income: $5,000
- Percentage of households with passive income: 19.8%
- Median total household income: $70,000
- Poverty rate: 11.0%

Photo Credit: ShengYing Lin / Shutterstock
13. Austin-Round Rock, TX
- Median passive income: $5,000
- Percentage of households with passive income: 20.3%
- Median total household income: $79,900
- Poverty rate: 10.1%

Photo Credit: Oleg Podzorov / Shutterstock
12. Chicago-Naperville-Elgin, IL-IN-WI
- Median passive income: $5,000
- Percentage of households with passive income: 20.4%
- Median total household income: $75,000
- Poverty rate: 10.6%

Photo Credit: Nicholas Courtney / Shutterstock
11. Denver-Aurora-Lakewood, CO
- Median passive income: $5,000
- Percentage of households with passive income: 23.4%
- Median total household income: $85,000
- Poverty rate: 7.9%

Photo Credit: LHBLLC / Shutterstock
10. Tucson, AZ
- Median passive income: $5,100
- Percentage of households with passive income: 19.7%
- Median total household income: $55,980
- Poverty rate: 13.8%

Photo Credit: Gregory E. Clifford / Shutterstock
9. Phoenix-Mesa-Scottsdale, AZ
- Median passive income: $5,200
- Percentage of households with passive income: 18.4%
- Median total household income: $67,000
- Poverty rate: 12.1%

Photo Credit: Sean Pavone / Shutterstock
8. Boston-Cambridge-Newton, MA-NH
- Median passive income: $5,300
- Percentage of households with passive income: 26.1%
- Median total household income: $93,100
- Poverty rate: 8.6%

Photo Credit: Victor Moussa / Shutterstock
7. New York-Newark-Jersey City, NY-NJ-PA
- Median passive income: $6,000
- Percentage of households with passive income: 21.4%
- Median total household income: $83,000
- Poverty rate: 11.6%

Photo Credit: Jon Bilous / Shutterstock
6. Riverside-San Bernardino-Ontario, CA
- Median passive income: $6,400
- Percentage of households with passive income: 13.9%
- Median total household income: $70,500
- Poverty rate: 12.2%

Photo Credit: Bogdan Vacarciuc / Shutterstock
5. San Francisco-Oakland-Hayward, CA
- Median passive income: $6,600
- Percentage of households with passive income: 32.1%
- Median total household income: $113,200
- Poverty rate: 8.2%

Photo Credit: Dancestrokes / Shutterstock
4. San Diego-Carlsbad, CA
- Median passive income: $7,500
- Percentage of households with passive income: 22.5%
- Median total household income: $83,000
- Poverty rate: 10.3%

Photo Credit: Sundry Photography / Shutterstock
3. San Jose-Sunnyvale-Santa Clara, CA
- Median passive income: $7,600
- Percentage of households with passive income: 33.9%
- Median total household income: $131,000
- Poverty rate: 6.3%

Photo Credit: Sean Pavone / Shutterstock
2. Los Angeles-Long Beach-Anaheim, CA
- Median passive income: $8,050
- Percentage of households with passive income: 19.1%
- Median total household income: $77,000
- Poverty rate: 12.4%

Photo Credit: Just dance / Shutterstock
1. Miami-Fort Lauderdale-West Palm Beach, FL
- Median passive income: $9,000
- Percentage of households with passive income: 16.9%
- Median total household income: $59,500
- Poverty rate: 13.5%
Detailed Findings & Methodology
To determine the metropolitan areas whose residents make the most passive income, researchers analyzed data from the U.S. Census Bureau’s 2019 American Community Survey Public Use Microdata Sample and the 2019 American Community Survey. Metro areas were ranked by median passive income among households who earn passive income. In the event of a tie, the metro with the larger percentage of households who earn passive income was ranked higher. Passive income includes interest, dividends, and net rental income. Researchers also calculated median total household income and the poverty rate.
Only metropolitan areas with at least 100,000 people were included in the analysis. Additionally, metro areas were grouped into the following cohorts based on population size:
- Small metros: 100,000–349,999
- Midsize metros: 350,000–999,999
- Large metros: 1,000,000 or more
