Photo Credit: BigBlueStudio / Shutterstock
In the last few years, it has become more common to order food from a kiosk, see machines cleaning airport floors, and talk to a chatbot instead of a customer service agent. The COVID-19 pandemic has accelerated the adoption of these technologies as well as others, many of which can be used to perform tasks that humans used to do. Machines do not call out sick or spread disease and can replace workers to aid in social distancing. While some jobs and tasks, especially those that require creativity and interpersonal skills, are not conducive to automation, many others are. According to data from the Bureau of Labor Statistics and Oxford University, 42% of U.S. workers are at high risk of automation.
Lower skilled jobs, especially those that involve repetition, are more likely to be automated. A Brookings study on automation’s impact on people finds that jobs in office administration, production, transportation, and food preparation are the most at risk of automation. These jobs are more conducive to automation because they involve either routine, physical labor, or information collection and processing activities. Often these types of jobs are lower-paying, but some jobs at low risk of automation include low-paying personal care and domestic service work.
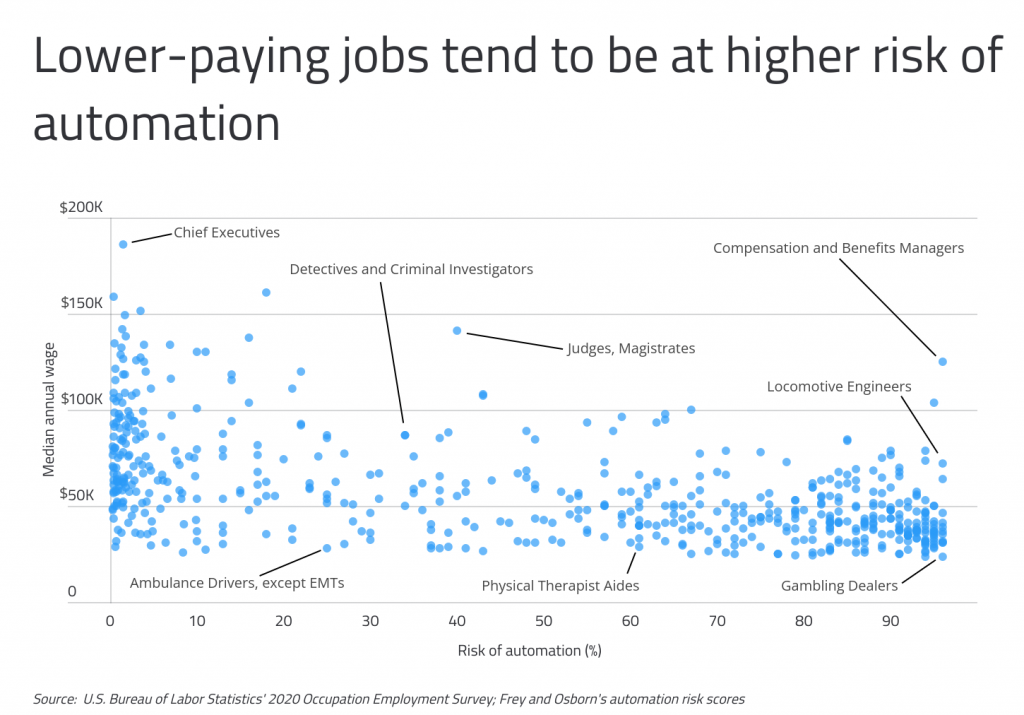
Data from the Bureau of Labor Statistics combined with automation risk data from a University of Oxford study shows a correlation between risk of automation and annual median wages. Gambling Dealers, who have a probability of automation of 96%, earn a median annual wage of less than $24,000. On the opposite end of the spectrum, Chief Executives have just a 1.5% risk of automation and earn a median annual wage of $186,000. Most occupations fall somewhere between these extremes.
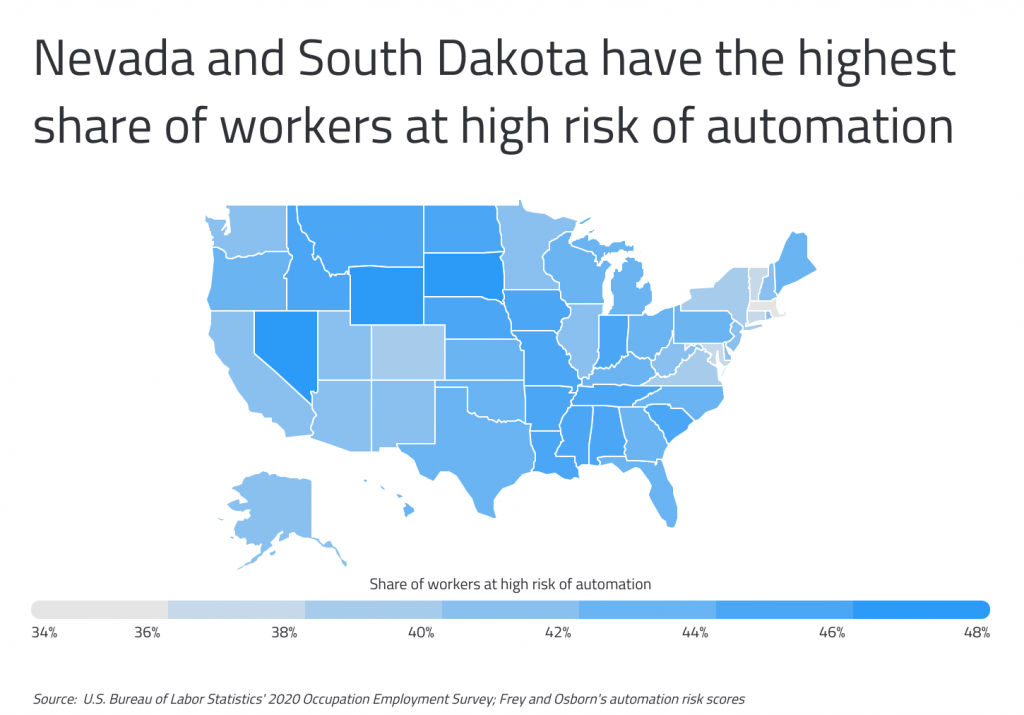
While automation will happen everywhere, its impacts will be felt more heavily in some parts of the country than others due to local industry makeup and worker skill set. The Brookings automation study finds that rural communities tend to have a much larger share of tasks that are susceptible to automation than do more populated areas. At the state level, Nevada and South Dakota have the highest share of workers at high risk of automation—defined here as occupations with automation risks of 0.7 or higher—at 48.4% and 46.9%, respectively. Nevada is one of just two states where casino-style gambling is legal state-wide, and gambling dealers are at very high risk of automation.
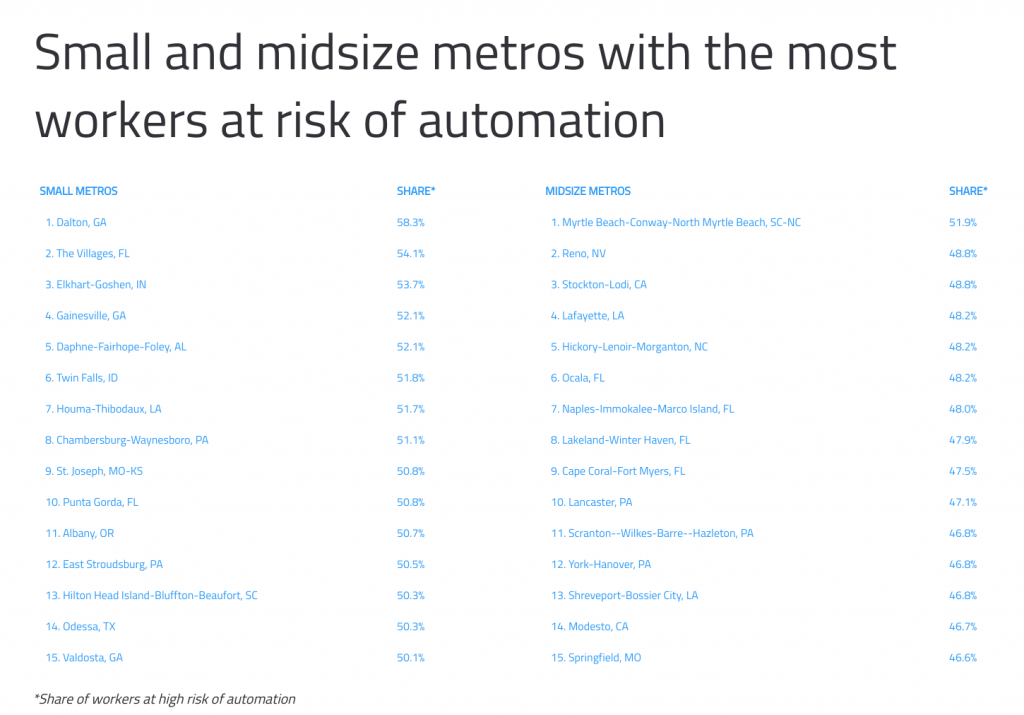
To determine the U.S. metropolitan areas with the most workers at risk of automation, researchers at Commodity.com analyzed the latest data from the U.S. Bureau of Labor Statistics and the University of Oxford. The researchers ranked metros according to the share of workers at high risk of automation, the total number of workers at high risk of automation, the share of workers at medium risk of automation, and the share of workers at low risk of automation. To improve relevance, only metropolitan areas with at least 100,000 people were included in the analysis.
Here are the metros with the most workers at risk of automation.
Large Metros With the Most Workers at Risk of Automation

Photo Credit: Chones / Shutterstock
15. Los Angeles-Long Beach-Anaheim, CA
- Share of workers at high risk of automation: 42.6%
- Total workers at high risk of automation: 1,644,440
- Share of workers at medium risk of automation: 19.4%
- Share of workers at low risk of automation: 38.0%

Photo Credit: dorinser / Shutterstock
14. Miami-Fort Lauderdale-West Palm Beach, FL
- Share of workers at high risk of automation: 42.7%
- Total workers at high risk of automation: 769,020
- Share of workers at medium risk of automation: 22.9%
- Share of workers at low risk of automation: 34.4%

Photo Credit: f11photo / Shutterstock
13. Dallas-Fort Worth-Arlington, TX
- Share of workers at high risk of automation: 42.8%
- Total workers at high risk of automation: 1,046,720
- Share of workers at medium risk of automation: 21.5%
- Share of workers at low risk of automation: 35.6%

Photo Credit: Sean Pavone / Shutterstock
12. St. Louis, MO-IL
- Share of workers at high risk of automation: 43.1%
- Total workers at high risk of automation: 383,540
- Share of workers at medium risk of automation: 19.4%
- Share of workers at low risk of automation: 37.5%

Photo Credit: GagliardiPhotography / Shutterstock
11. Jacksonville, FL
- Share of workers at high risk of automation: 43.2%
- Total workers at high risk of automation: 205,280
- Share of workers at medium risk of automation: 22.3%
- Share of workers at low risk of automation: 34.5%

Photo Credit: Sean Pavone / Shutterstock
10. Birmingham-Hoover, AL
- Share of workers at high risk of automation: 43.4%
- Total workers at high risk of automation: 155,150
- Share of workers at medium risk of automation: 20.8%
- Share of workers at low risk of automation: 35.9%

Photo Credit: jdross75 / Shutterstock
9. Nashville-Davidson–Murfreesboro–Franklin, TN
- Share of workers at high risk of automation: 43.4%
- Total workers at high risk of automation: 289,600
- Share of workers at medium risk of automation: 19.6%
- Share of workers at low risk of automation: 37.0%
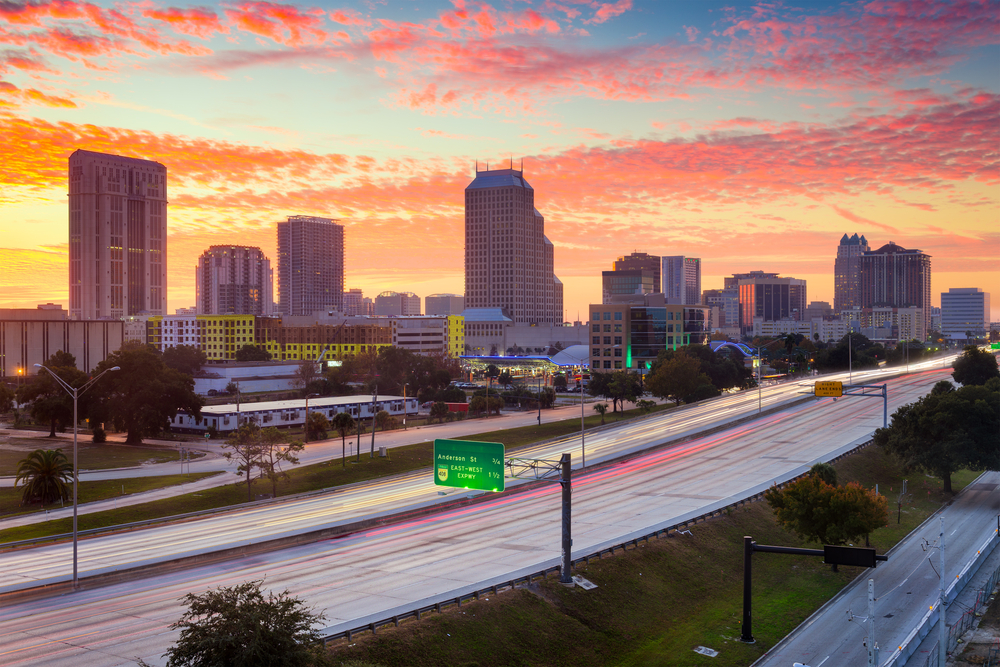
Photo Credit: Sean Pavone / Shutterstock
8. Orlando-Kissimmee-Sanford, FL
- Share of workers at high risk of automation: 44.0%
- Total workers at high risk of automation: 361,400
- Share of workers at medium risk of automation: 23.3%
- Share of workers at low risk of automation: 32.6%

Photo Credit: f11photo / Shutterstock
7. New Orleans-Metairie, LA
- Share of workers at high risk of automation: 44.3%
- Total workers at high risk of automation: 158,550
- Share of workers at medium risk of automation: 19.5%
- Share of workers at low risk of automation: 36.2%

Photo Credit: Sean Pavone / Shutterstock
6. Indianapolis-Carmel-Anderson, IN
- Share of workers at high risk of automation: 44.6%
- Total workers at high risk of automation: 309,530
- Share of workers at medium risk of automation: 20.4%
- Share of workers at low risk of automation: 35.0%
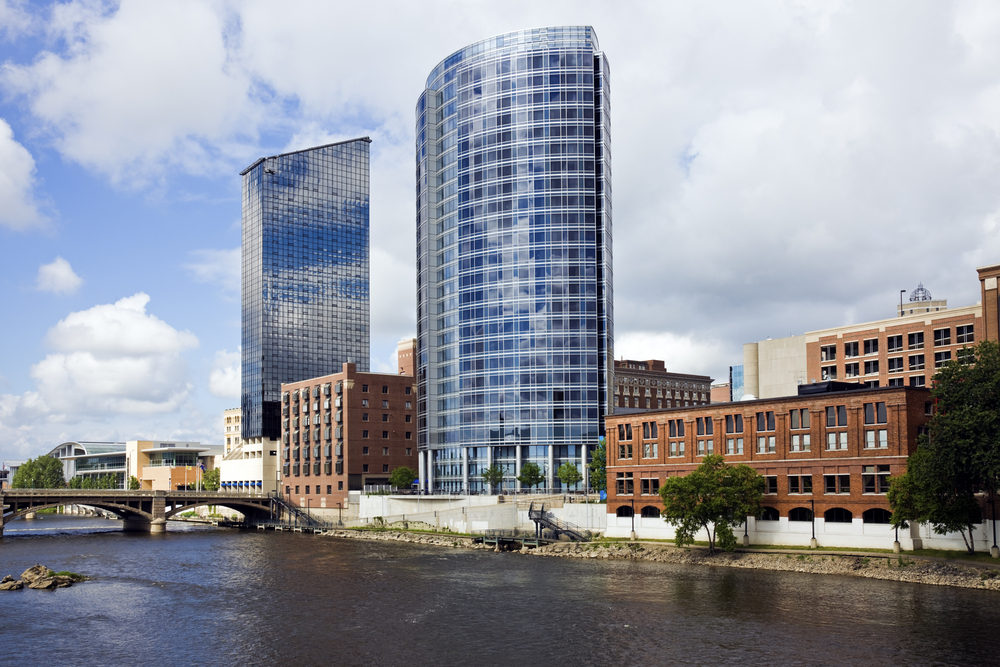
Photo Credit: Henryk Sadura / Shutterstock
5. Grand Rapids-Wyoming, MI
- Share of workers at high risk of automation: 44.9%
- Total workers at high risk of automation: 158,220
- Share of workers at medium risk of automation: 21.6%
- Share of workers at low risk of automation: 33.5%

Photo Credit: Sean Pavone / Shutterstock
4. Louisville/Jefferson County, KY-IN
- Share of workers at high risk of automation: 45.1%
- Total workers at high risk of automation: 185,580
- Share of workers at medium risk of automation: 21.6%
- Share of workers at low risk of automation: 33.3%

Photo Credit: The Speedy Butterfly / Shutterstock
3. Memphis, TN-MS-AR
- Share of workers at high risk of automation: 47.4%
- Total workers at high risk of automation: 202,640
- Share of workers at medium risk of automation: 20.4%
- Share of workers at low risk of automation: 32.2%

Photo Credit: Jon Bilous / Shutterstock
2. Riverside-San Bernardino-Ontario, CA
- Share of workers at high risk of automation: 48.8%
- Total workers at high risk of automation: 476,660
- Share of workers at medium risk of automation: 20.1%
- Share of workers at low risk of automation: 31.1%
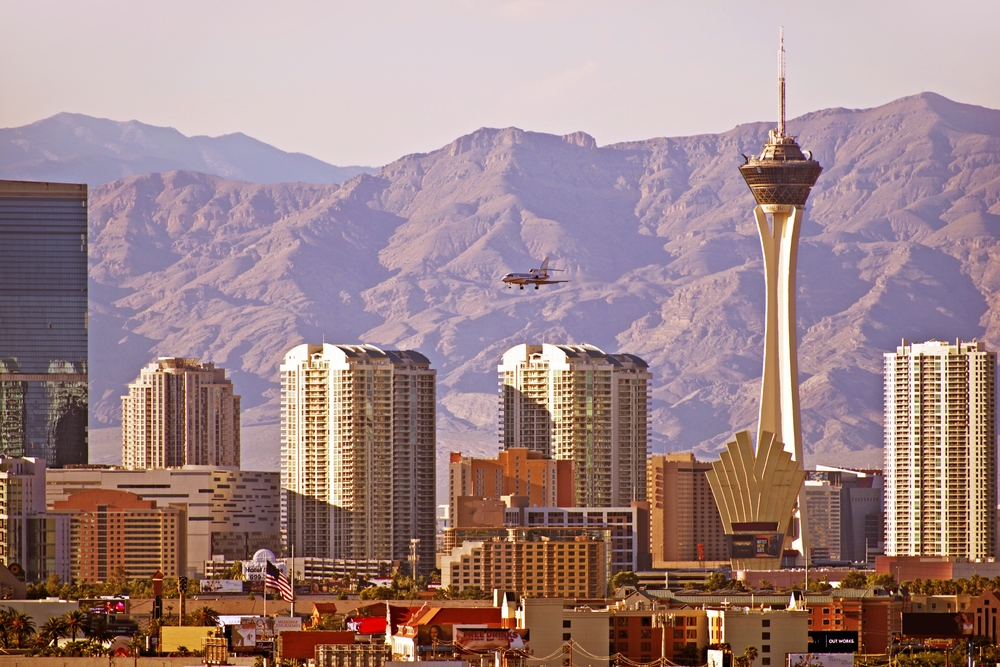
Photo Credit: Virrage Images / Shutterstock
1. Las Vegas-Henderson-Paradise, NV
- Share of workers at high risk of automation: 49.3%
- Total workers at high risk of automation: 307,650
- Share of workers at medium risk of automation: 22.7%
- Share of workers at low risk of automation: 28.0%
Detailed Findings & Methodology
To determine the U.S. metropolitan areas with the most workers at risk of automation, researchers at Commodity.com analyzed the latest data from the U.S. Bureau of Labor Statistics’s Occupational Employment Survey and a University of Oxford study The Future of Employment: How Susceptible Are Jobs to Computerization? The researchers ranked metros according to the share of workers at high risk of automation. In the event of a tie, the metro with the higher percentage of workers at high risk of automation was ranked higher. Researchers also calculated the shares of workers at medium risk and low risk of automation. Occupations at high risk of automation are defined as those jobs with risks of automation of 0.7 and higher. Occupations at medium risk of automation are defined as jobs with automation risks between 0.3 and 0.7, while occupations at low risk of automation are defined as jobs with automation risks less than 0.3.
To improve relevance, only metropolitan areas with at least 100,000 people were included in the analysis. Additionally, metro areas were grouped into the following cohorts based on population size:
- Small metros: 100,000-350,000
- Midsize metros: 350,000-1,000,000
- Large metros: more than 1,000,000