Photo Credit: djrandco / Shutterstock
Generation Z—or Gen Z for short—is the generation succeeding millennials that represents about 20% of the U.S. population. The Brookings Institute’s definition of Gen Z is people born between 1997 and 2012, the oldest of which are now just beginning their careers. While members of Gen Z currently account for less than 5% of the U.S. full-time workforce, this number will increase rapidly in the coming decades.

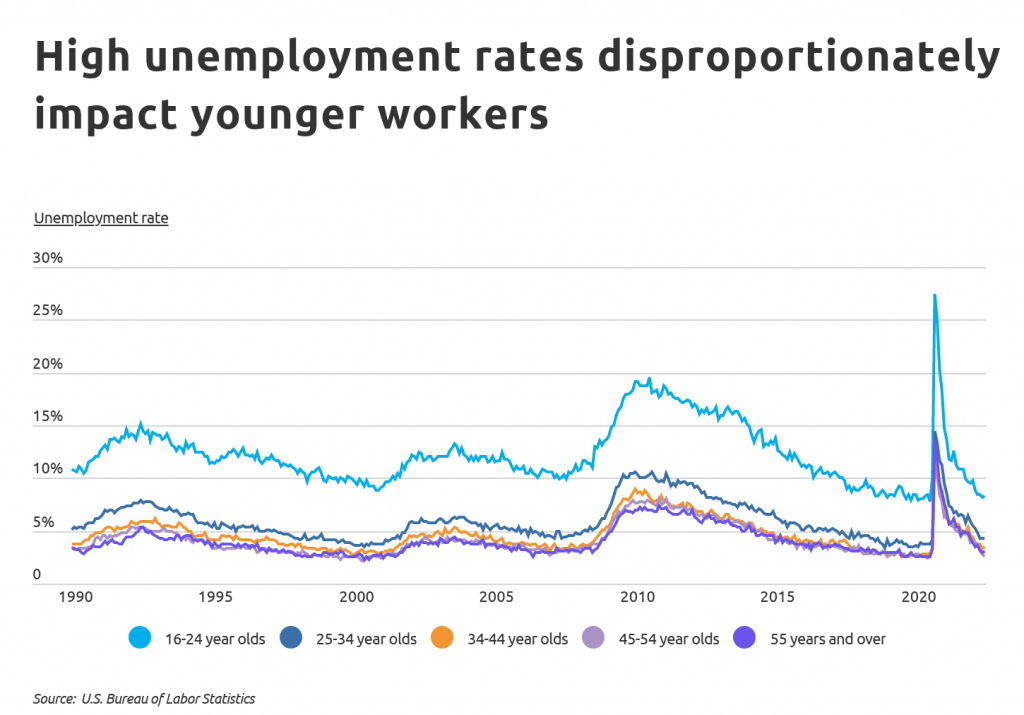
When compared to millennials who largely entered the workforce in the wake of the Great Recession, Gen Zers face a much different job market and set of economic conditions. Even though unemployment rates spiked at the beginning of the COVID-19 pandemic—something that disproportionately impacts younger workers—the economy has made great strides in its recovery since then, and the unemployment rate for all age groups has fallen below levels observed a decade ago. Wages are rising rapidly, and businesses are struggling to find and retain workers. Taken together, these conditions better position Generation Z to avoid many of the financial challenges—namely underemployment and stagnant wages—that plagued millennials when they were the same age.

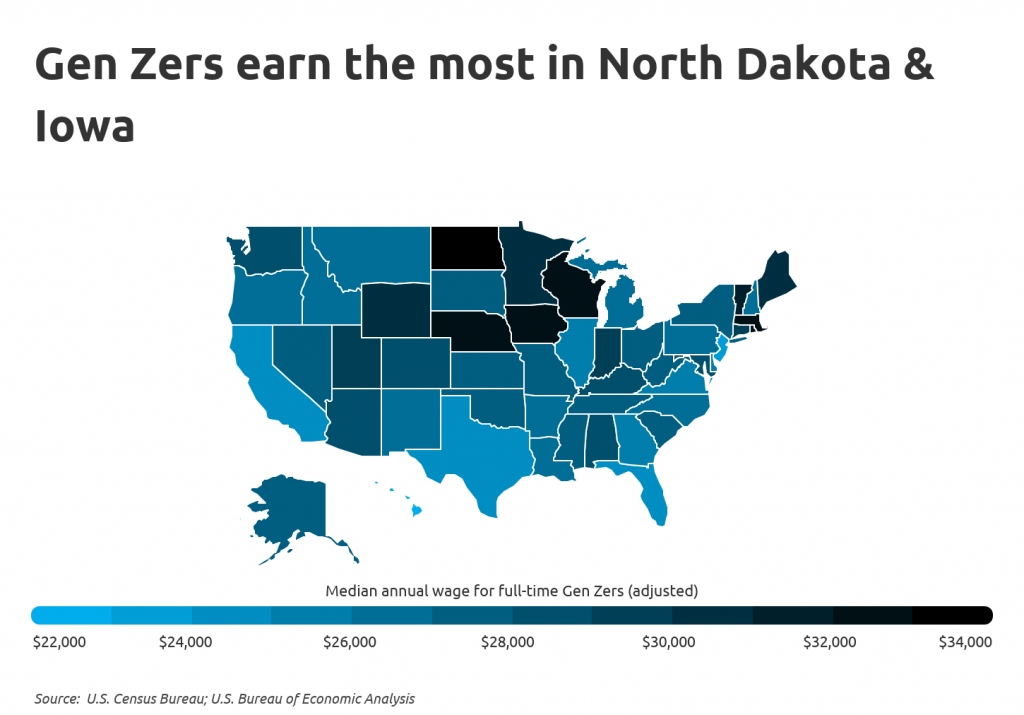
Naturally, because the oldest Gen Zers are just starting out in their careers, they tend to earn less than their older counterparts. According to data from the U.S. Census Bureau, the national median wage for full-time Gen Zers was $26,000 in 2020, just slightly more than half of the median wage for all full-time workers ($50,000). However, wages are highly location-dependent. When taking the cost of living into account, Gen Zers in North Dakota and Iowa earned the most in 2020, at $33,681 and $32,950 respectively. Gen Zers in New England and other Midwestern states also earned high cost-of-living adjusted wages, due to mostly below-average living costs. Conversely, workers in Hawaii and New Jersey—two of the nation’s most expensive states—earned the least after adjusting for cost of living.

To determine the best-paying metropolitan areas for Gen Zers, researchers at Self Financial analyzed the latest data from the U.S. Census Bureau and the U.S. Bureau of Economic Analysis. Metro areas were ranked by the cost-of-living adjusted median annual wage for full-time Gen Zers. Researchers also calculated the unadjusted median annual wage for full-time Gen Zers, the unadjusted median annual wage for all full-time workers, and Gen Z’s share of the full-time labor force. Only the 100 largest metros were included in the analysis.
The Best-Paying Metros for Generation Z

Photo Credit: Jon Bilous / Shutterstock
15. Minneapolis-St. Paul-Bloomington, MN-WI
- Median annual wage for full-time Gen Zers (adjusted): $30,236
- Median annual wage for full-time Gen Zers (actual): $31,200
- Median annual wage for all full-time workers (actual): $60,000
- Cost of living (compared to average): +3.2%
- Gen Z share of the labor force: 4.4%

Photo Credit: / Shutterstock
14. Louisville/Jefferson County, KY-IN
- Median annual wage for full-time Gen Zers (adjusted): $30,465
- Median annual wage for full-time Gen Zers (actual): $28,000
- Median annual wage for all full-time workers (actual): $50,000
- Cost of living (compared to average): -8.1%
- Gen Z share of the labor force: 5.4%

Photo Credit: arburkholder / Shutterstock
13. Lancaster, PA
- Median annual wage for full-time Gen Zers (adjusted): $30,465
- Median annual wage for full-time Gen Zers (actual): $30,000
- Median annual wage for all full-time workers (actual): $50,000
- Cost of living (compared to average): -1.5%
- Gen Z share of the labor force: 8.1%

Photo Credit: Sean Pavone / Shutterstock
12. Springfield, MA
- Median annual wage for full-time Gen Zers (adjusted): $30,630
- Median annual wage for full-time Gen Zers (actual): $30,000
- Median annual wage for all full-time workers (actual): $54,000
- Cost of living (compared to average): -2.1%
- Gen Z share of the labor force: 4.6%

Photo Credit: photo.ua / Shutterstock
11. Salt Lake City, UT
- Median annual wage for full-time Gen Zers (adjusted): $30,700
- Median annual wage for full-time Gen Zers (actual): $30,000
- Median annual wage for all full-time workers (actual): $50,000
- Cost of living (compared to average): -2.3%
- Gen Z share of the labor force: 6.7%

Photo Credit: Photosbykaity / Shutterstock
10. Grand Rapids-Wyoming, MI
- Median annual wage for full-time Gen Zers (adjusted): $30,718
- Median annual wage for full-time Gen Zers (actual): $29,100
- Median annual wage for all full-time workers (actual): $50,000
- Cost of living (compared to average): -5.3%
- Gen Z share of the labor force: 4.7%

Photo Credit: Rosamar / Shutterstock
9. Cincinnati, OH-KY-IN
- Median annual wage for full-time Gen Zers (adjusted): $31,024
- Median annual wage for full-time Gen Zers (actual): $29,000
- Median annual wage for all full-time workers (actual): $51,000
- Cost of living (compared to average): -6.5%
- Gen Z share of the labor force: 4.9%

Photo Credit: Jon Bilous / Shutterstock
8. Harrisburg-Carlisle, PA
- Median annual wage for full-time Gen Zers (adjusted): $31,094
- Median annual wage for full-time Gen Zers (actual): $30,000
- Median annual wage for all full-time workers (actual): $50,000
- Cost of living (compared to average): -3.5%
- Gen Z share of the labor force: 4.1%

Photo Credit: Sean Pavone / Shutterstock
7. Milwaukee-Waukesha-West Allis, WI
- Median annual wage for full-time Gen Zers (adjusted): $31,272
- Median annual wage for full-time Gen Zers (actual): $30,000
- Median annual wage for all full-time workers (actual): $50,000
- Cost of living (compared to average): -4.1%
- Gen Z share of the labor force: 5.5%

Photo Credit: DomVisuals / Shutterstock
6. Omaha-Council Bluffs, NE-IA
- Median annual wage for full-time Gen Zers (adjusted): $31,476
- Median annual wage for full-time Gen Zers (actual): $30,000
- Median annual wage for all full-time workers (actual): $50,000
- Cost of living (compared to average): -4.7%
- Gen Z share of the labor force: 5.4%

Photo Credit: Rudy Balasko / Shutterstock
5. Indianapolis-Carmel-Anderson, IN
- Median annual wage for full-time Gen Zers (adjusted): $31,677
- Median annual wage for full-time Gen Zers (actual): $30,000
- Median annual wage for all full-time workers (actual): $50,000
- Cost of living (compared to average): -5.3%
- Gen Z share of the labor force: 5.1%

Photo Credit: Sean Pavone / Shutterstock
4. Boston-Cambridge-Newton, MA-NH
- Median annual wage for full-time Gen Zers (adjusted): $31,755
- Median annual wage for full-time Gen Zers (actual): $35,000
- Median annual wage for all full-time workers (actual): $70,000
- Cost of living (compared to average): +10.2%
- Gen Z share of the labor force: 3.2%

Photo Credit: Sean Pavone / Shutterstock
3. Worcester, MA-CT
- Median annual wage for full-time Gen Zers (adjusted): $32,203
- Median annual wage for full-time Gen Zers (actual): $32,400
- Median annual wage for all full-time workers (actual): $60,000
- Cost of living (compared to average): +0.6%
- Gen Z share of the labor force: 3.9%

Photo Credit: Sean Pavone / Shutterstock
2. Albany-Schenectady-Troy, NY
- Median annual wage for full-time Gen Zers (adjusted): $32,204
- Median annual wage for full-time Gen Zers (actual): $32,300
- Median annual wage for all full-time workers (actual): $60,000
- Cost of living (compared to average): +0.3%
- Gen Z share of the labor force: 3.5%

Photo Credit: Wendell Guy / Shutterstock
1. Bridgeport-Stamford-Norwalk, CT
- Median annual wage for full-time Gen Zers (adjusted): $37,884
- Median annual wage for full-time Gen Zers (actual): $40,000
- Median annual wage for all full-time workers (actual): $72,000
- Cost of living (compared to average): +5.6%
- Gen Z share of the labor force: 3.5%
Detailed Findings & Methodology
To determine the best-paying metropolitan areas for Gen Zers, researchers at Self analyzed earnings data from the U.S. Census Bureau’s 2020 American Community Survey Public Use Microdata Sample and cost-of-living data from the U.S. Bureau of Economic Analysis’s 2020 Regional Price Parity dataset. Metro areas were ranked by the cost-of-living adjusted median annual wage for full-time Gen Zers. In the event of a tie, the metro with the higher unadjusted median annual wage for full-time Gen Zers was ranked higher. Researchers also calculated the median annual wage for all full-time workers, and Gen Z’s share of the full-time labor force. The Brookings Institution defines Gen Z as people born from 1997 to 2012. This analysis focuses on full-time Gen Z workers who were 16 to 23 in 2020. Only the 100 largest metros were included in the analysis.