
Photo Credit: G-Stock Studio / Shutterstock
Self-employed entrepreneurs account for 10% of all workers, according to 2020 data from the U.S. Census Bureau. But whether born out of necessity or desire, an increasing number of workers are taking the plunge and starting their own businesses in the wake of the COVID-19 pandemic. After an initial drop in new business applications in early 2020, monthly business applications soared to record levels, and the most recent data shows that applications remain significantly higher than they were a few years ago.
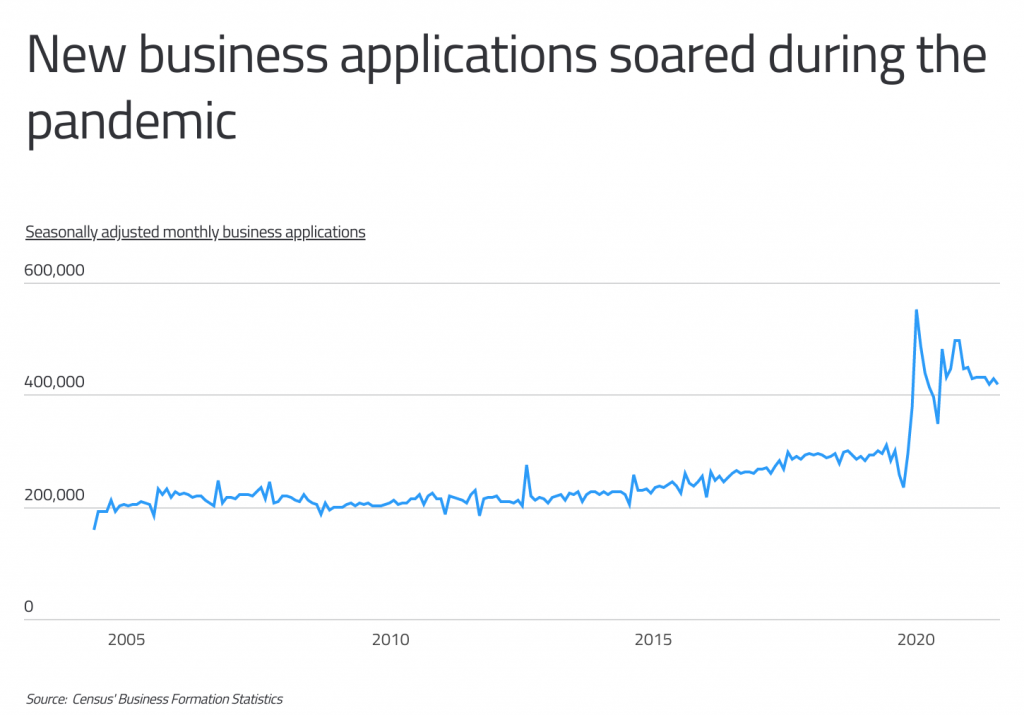
The recent escalation in new business formation is due to several factors. First, as many businesses cut back operations or shut their doors completely, a wave of newly-unemployed workers opened their own businesses in response. Additionally, a combination of business closures, supply chain problems, and changing consumer preferences created space in the market for new types of businesses to enter. Quit rates also reached record levels in recent months, as many workers have been driven by the pandemic to reassess their careers and start something of their own.
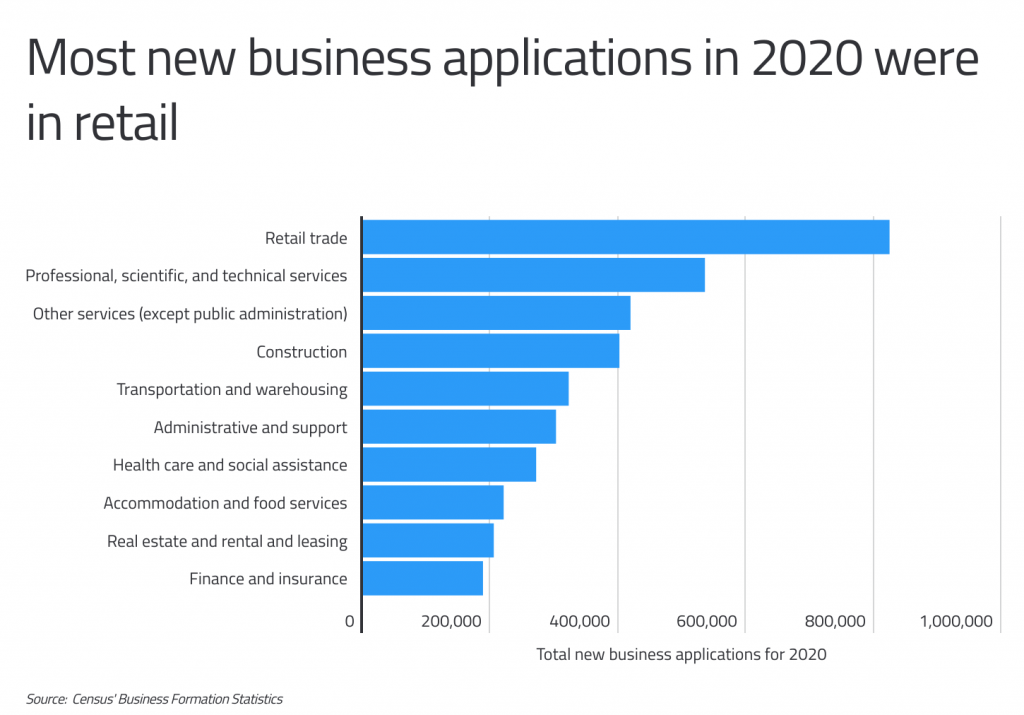
In total, new business applications increased by nearly 25% in the first year of the pandemic, but nearly a third of all applications were concentrated in two sectors: retail trade and professional, scientific, and technical services. Retail trade applications numbered 824,840 in 2020, or 19% of all applications. Professional service applications numbered over half a million, roughly 12% of the total. Recent research from the University of Maryland indicates that the increase in new business applications has been driven largely by non-employer firms—such as sole proprietors, partnerships, or limited liability companies without employees.
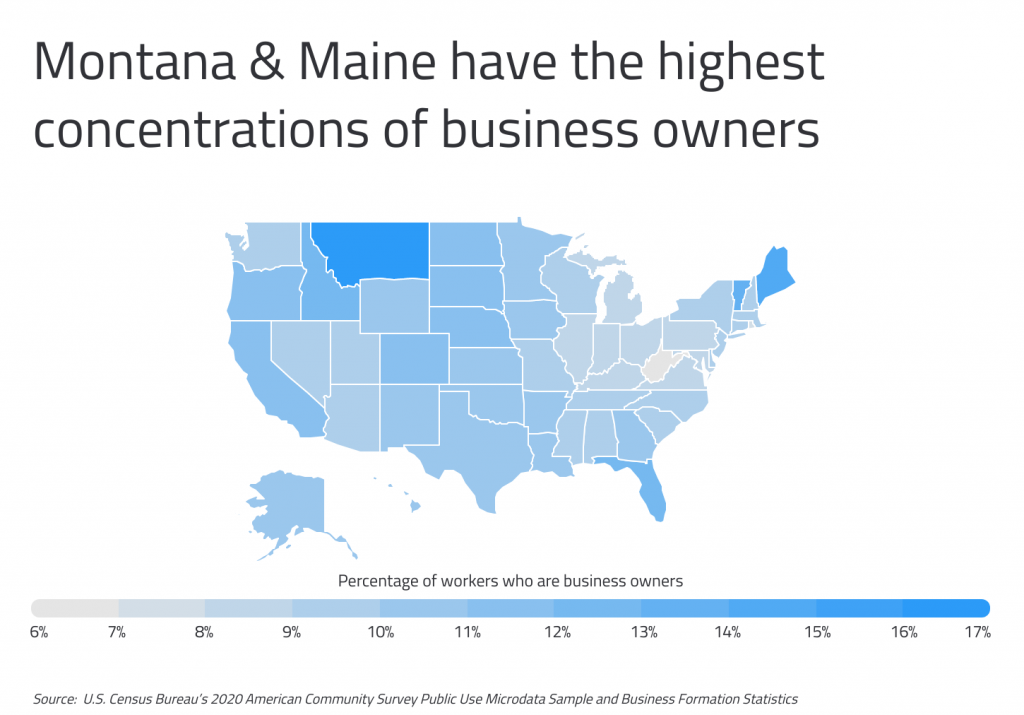
While roughly one out of 10 U.S. workers are entrepreneurs, some regions of the country have far higher concentrations. Almost 17% of all workers in Montana and 14% of workers in Maine are self-employed in either their own incorporated or unincorporated businesses. Other states with large concentrations of entrepreneurs include Vermont (13.0%), Florida (12.5%), and Idaho (12.4%). On the other hand, self-employment in Rust Belt states like West Virginia, Ohio, Pennsylvania, Kentucky, and Indiana is less common. Just 6.8% of workers in West Virginia are entrepreneurs.
To find the metropolitan areas with the most entrepreneurs, researchers at Commodity.com analyzed data from the U.S. Census Bureau. The researchers ranked metros according to the percentage of workers who are business owners. Researchers also calculated the total number of business owners, the total number of new business applications in 2020, median annual income for full-time business owners, and median annual income for all full-time workers. Only the 100 most populous metro areas were included in the analysis.
Major U.S. Metros With the Most Entrepreneurs

Photo Credit: mnapoli / Shutterstock
15. Little Rock-North Little Rock-Conway, AR
- Percentage of workers who are business owners: 11.3%
- Total number of business owners: 36,315
- Total number of new business applications in 2020: 11,132
- Median annual income for full-time business owners: $45,000
- Median annual income for all full-time workers: $48,000

Photo Credit: arburkholder / Shutterstock
14. Lancaster, PA
- Percentage of workers who are business owners: 11.5%
- Total number of business owners: 31,500
- Total number of new business applications in 2020: 3,919
- Median annual income for full-time business owners: $60,000
- Median annual income for all full-time workers: $54,000

Photo Credit: Bonnie Taylor Barry / Shutterstock
13. Lafayette, LA
- Percentage of workers who are business owners: 11.7%
- Total number of business owners: 27,264
- Total number of new business applications in 2020: 7,620
- Median annual income for full-time business owners: $50,000
- Median annual income for all full-time workers: $48,000
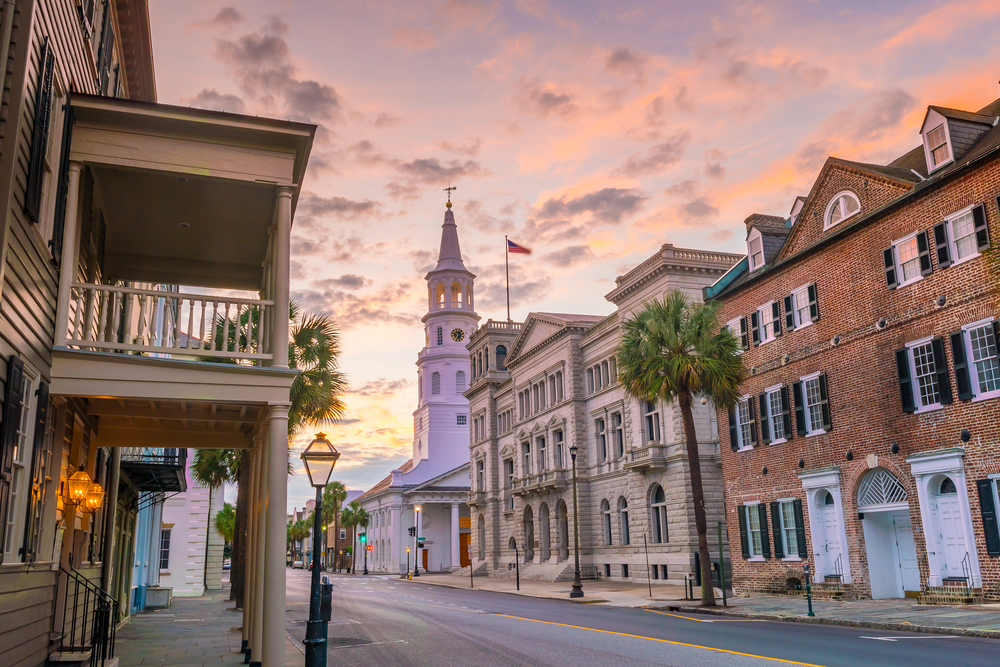
Photo Credit: f11photo / Shutterstock
12. Charleston-North Charleston, SC
- Percentage of workers who are business owners: 11.8%
- Total number of business owners: 47,614
- Total number of new business applications in 2020: 14,359
- Median annual income for full-time business owners: $65,000
- Median annual income for all full-time workers: $50,000

Photo Credit: ShengYing Lin / Shutterstock
11. Austin-Round Rock, TX
- Percentage of workers who are business owners: 11.8%
- Total number of business owners: 143,075
- Total number of new business applications in 2020: 34,716
- Median annual income for full-time business owners: $65,100
- Median annual income for all full-time workers: $60,000

Photo Credit: trekandshoot / Shutterstock
10. Oxnard-Thousand Oaks-Ventura, CA
- Percentage of workers who are business owners: 12.1%
- Total number of business owners: 47,947
- Total number of new business applications in 2020: 6,898
- Median annual income for full-time business owners: $70,000
- Median annual income for all full-time workers: $60,200

Photo Credit: Wendell Guy / Shutterstock
9. Bridgeport-Stamford-Norwalk, CT
- Percentage of workers who are business owners: 12.2%
- Total number of business owners: 57,354
- Total number of new business applications in 2020: 13,873
- Median annual income for full-time business owners: $74,000
- Median annual income for all full-time workers: $77,000

Photo Credit: Sean Pavone / Shutterstock
8. New Orleans-Metairie, LA
- Percentage of workers who are business owners: 12.3%
- Total number of business owners: 68,738
- Total number of new business applications in 2020: 29,830
- Median annual income for full-time business owners: $50,000
- Median annual income for all full-time workers: $50,000

Photo Credit: Chones / Shutterstock
7. Los Angeles-Long Beach-Anaheim, CA
- Percentage of workers who are business owners: 12.3%
- Total number of business owners: 766,024
- Total number of new business applications in 2020: 198,477
- Median annual income for full-time business owners: $52,000
- Median annual income for all full-time workers: $55,000
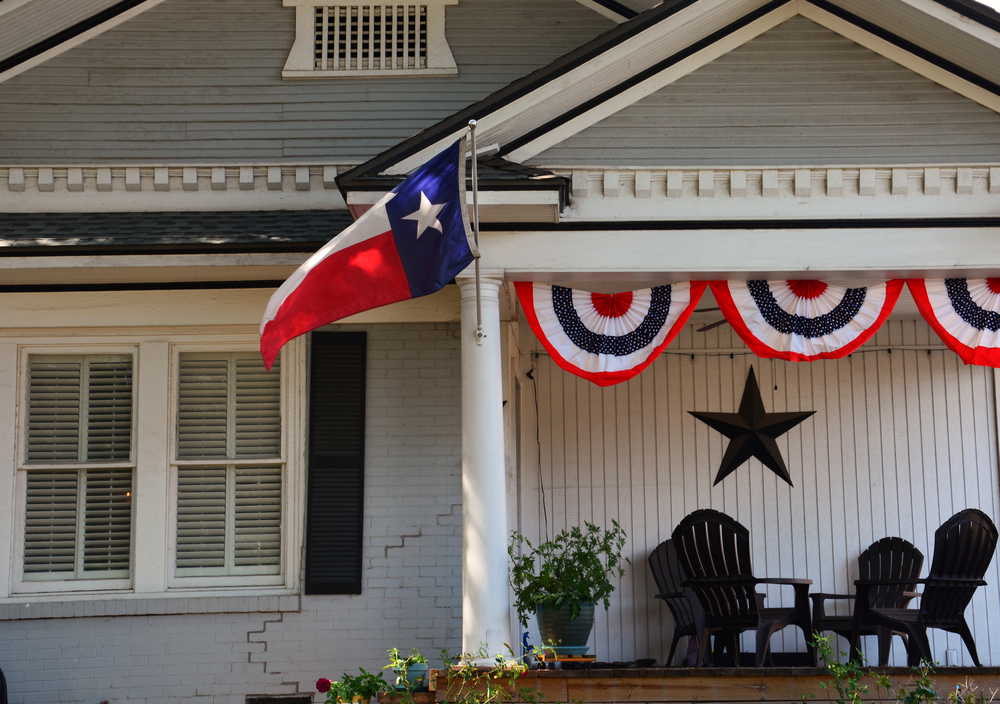
Photo Credit: D Guest Smith / Shutterstock
6. McAllen-Edinburg-Mission, TX
- Percentage of workers who are business owners: 12.8%
- Total number of business owners: 41,838
- Total number of new business applications in 2020: 6,188
- Median annual income for full-time business owners: $30,000
- Median annual income for all full-time workers: $36,600

Photo Credit: lunamarina / Shutterstock
5. Cape Coral-Fort Myers, FL
- Percentage of workers who are business owners: 12.8%
- Total number of business owners: 44,029
- Total number of new business applications in 2020: 13,000
- Median annual income for full-time business owners: $55,000
- Median annual income for all full-time workers: $45,000

Photo Credit: Jon Bilous / Shutterstock
4. Deltona-Daytona Beach-Ormond Beach, FL
- Percentage of workers who are business owners: 13.0%
- Total number of business owners: 35,668
- Total number of new business applications in 2020: 10,271
- Median annual income for full-time business owners: $51,000
- Median annual income for all full-time workers: $45,000

Photo Credit: Jon Bilous / Shutterstock
3. Asheville, NC
- Percentage of workers who are business owners: 13.4%
- Total number of business owners: 31,283
- Total number of new business applications in 2020: 4,810
- Median annual income for full-time business owners: $42,250
- Median annual income for all full-time workers: $42,250
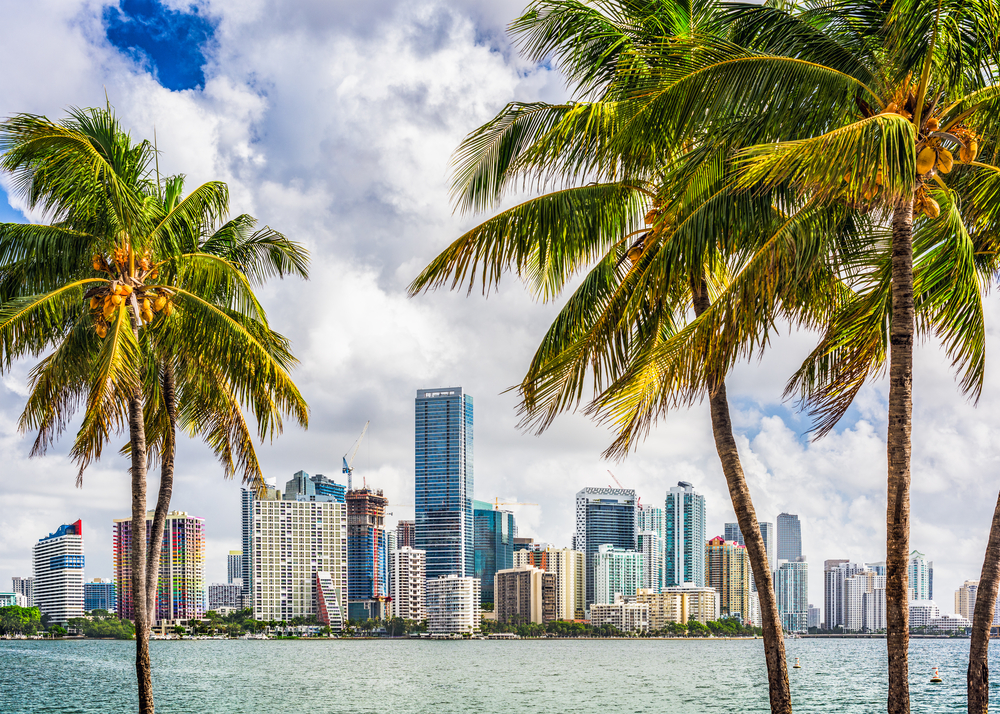
Photo Credit: Sean Pavone / Shutterstock
2. Miami-Fort Lauderdale-West Palm Beach, FL
- Percentage of workers who are business owners: 14.7%
- Total number of business owners: 439,795
- Total number of new business applications in 2020: 217,834
- Median annual income for full-time business owners: $41,000
- Median annual income for all full-time workers: $45,000

Photo Credit: Sean Pavone / Shutterstock
1. North Port-Sarasota-Bradenton, FL
- Percentage of workers who are business owners: 16.4%
- Total number of business owners: 56,259
- Total number of new business applications in 2020: 13,328
- Median annual income for full-time business owners: $50,000
- Median annual income for all full-time workers: $52,000
Detailed Findings & Methodology
To find the metropolitan areas with the most entrepreneurs, researchers at Commodity.com analyzed data from the U.S. Census Bureau’s 2020 American Community Survey Public Use Microdata Sample and Business Formation Statistics. The researchers ranked metros according to the percentage of workers who are business owners. In the event of a tie, the metro with the larger total number of business owners was ranked higher. Researchers also calculated the total number of new business applications in 2020, median annual income for full-time business owners, and median annual income for all full-time workers. Business owners are defined as self-employed workers who have their own incorporated or unincorporated businesses. Only the 100 most populous metro areas were included in the analysis.