Photo Credit: Breadmaker / Shutterstock
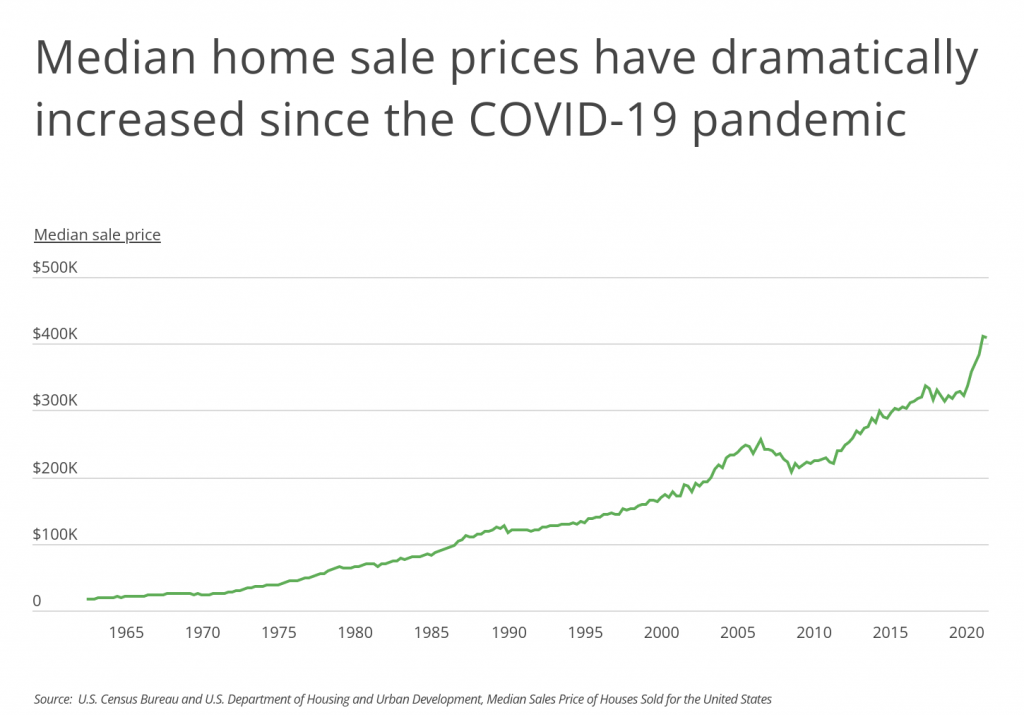
One of the dominant economic stories since the COVID-19 pandemic began has been the fiercely competitive housing market. The median sales price of a home in the U.S. topped $400,000 for the first time in 2021 amid aggressive buyer offers and bidding wars in markets all across the country.
The current challenges of the housing market have come from a potent combination of supply- and demand-side factors. The U.S. has underbuilt housing supply for years, with mortgage lender Freddie Mac estimating a shortage of 3.8 million housing units as of 2020. The COVID-19 pandemic has brought additional struggles, as supply chain constraints and labor shortages have raised costs and made it difficult for builders to keep up. On the demand side, the Millennial generation are in a peak period for buying homes, and a years-long run of low mortgage interest rates has attracted many buyers into the market. More recently, the COVID-19 pandemic brought wage increases for many professions and greater shifts to remote work that raised demand for larger homes.
The result has been a hypercompetitive housing market that has produced a dramatic spike in home prices since the beginning of 2020. Before the pandemic began, the median sales price of a U.S. home was $329,000. By the third quarter of 2021, the median sales price soared to a peak of $411,200, before declining slightly to $408,100 in the last few months of 2021. With more than half of homes now selling for above $400,000, fewer options are available for lower-income or first-time buyers, and current homeowners looking to upgrade to larger or nicer homes are having to pay a higher price to do so.
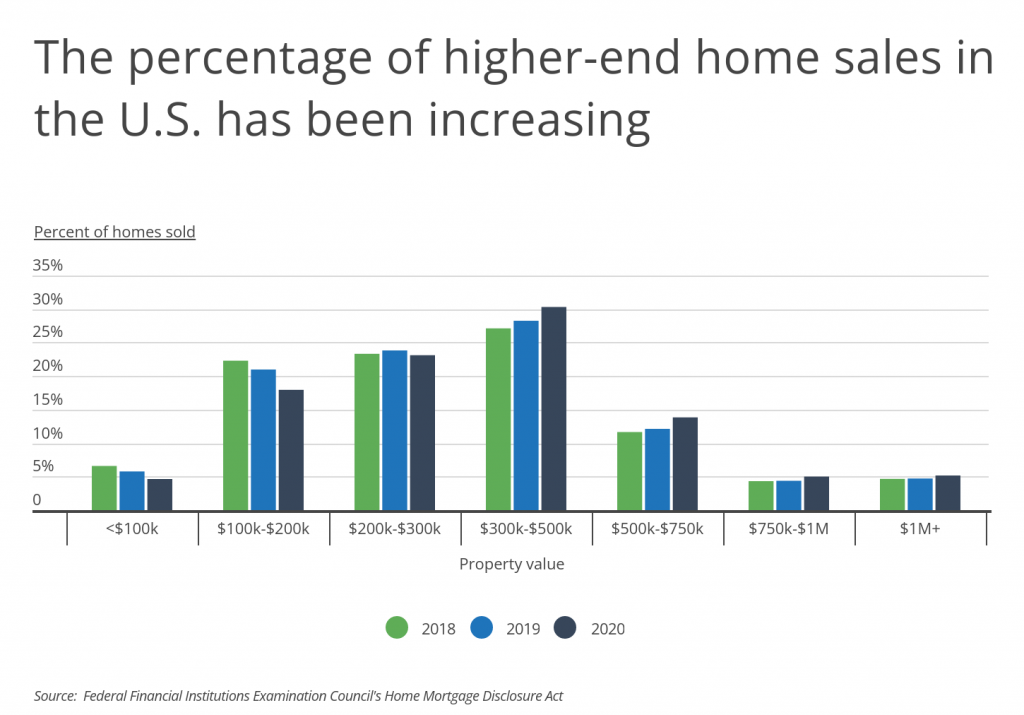
But even before the recent spike, higher-end home sales in the U.S. had been increasing in share over time. In 2018, just over half of homes sold—52.21%—had a value of $300,000 or less, but by 2020, that figure had declined to 45.69%. The share of homes selling between $300,000 and $500,000, which represents a plurality of home purchases, increased in each year from 2018 to 2020. And the luxury home market has not been immune either: in 2020, the percentage of homes selling between $750,000 and $1 million and the percentage of homes selling above $1 million each topped 5% for the first time.
While rising home prices are a nationwide phenomenon, geography plays a major role in how much home buyers can get for their dollar. In California, more than one in five homes sell for over $1 million, and other notably expensive states including Hawaii (17.51%), Massachusetts (10.18%), and New York (9.7%) are also at the top of the list for million dollar home sales. In these locations, a home that sells above $1 million may be comparable in size, condition, and amenities to homes that sell for substantially less in other parts of the country. In contrast, 16 states have 1% or less of homes selling for at least $1 million, and in these locations, such homes may be some of the most luxurious properties available.

The impact of location on property values is even more apparent at the local level. The top four metros for home sales above $1 million are all located in California, and in the nation-leading San Jose metro, nearly two-thirds of houses top $1 million in price.
To determine the metros with the highest percentage of luxury home sales, researchers at Inspection Support Network analyzed the latest data from the Home Mortgage Disclosure Act. Only conventional, home purchase loans that originated in 2020 were considered in the analysis. The researchers ranked metro areas by the percentage of mortgaged home sales greater than $1 million. In the event of a tie, the metro with the larger median property value for greater-than-$1 million homes was ranked higher. To improve relevance, only metropolitan areas with at least 100,000 residents were included.
Here are the cities with the highest percentage of luxury home sales.

Large Metros With the Highest Share of $1M+ Home Sales

Photo Credit: Gregory E. Clifford / Shutterstock
15. Phoenix-Mesa-Chandler, AZ
- Percentage of luxury home sales ($1M+): 3.11%
- Median property value for $1M+ homes: $1,345,000
- Median income for $1M+ buyers: $350,000
- Median down payment for $1M+ homes: $410,000

Photo Credit: Bob Pool / Shutterstock
14. Portland-Vancouver-Hillsboro, OR-WA
- Percentage of luxury home sales ($1M+): 3.38%
- Median property value for $1M+ homes: $1,255,000
- Median income for $1M+ buyers: $315,000
- Median down payment for $1M+ homes: $390,000

Photo Credit: jdross75 / Shutterstock
13. Nashville-Davidson–Murfreesboro–Franklin, TN
- Percentage of luxury home sales ($1M+): 3.92%
- Median property value for $1M+ homes: $1,335,000
- Median income for $1M+ buyers: $336,000
- Median down payment for $1M+ homes: $420,000

Photo Credit: Roschetzky Photography / Shutterstock
12. Austin-Round Rock-Georgetown, TX
- Percentage of luxury home sales ($1M+): 4.30%
- Median property value for $1M+ homes: $1,375,000
- Median income for $1M+ buyers: $377,000
- Median down payment for $1M+ homes: $410,000
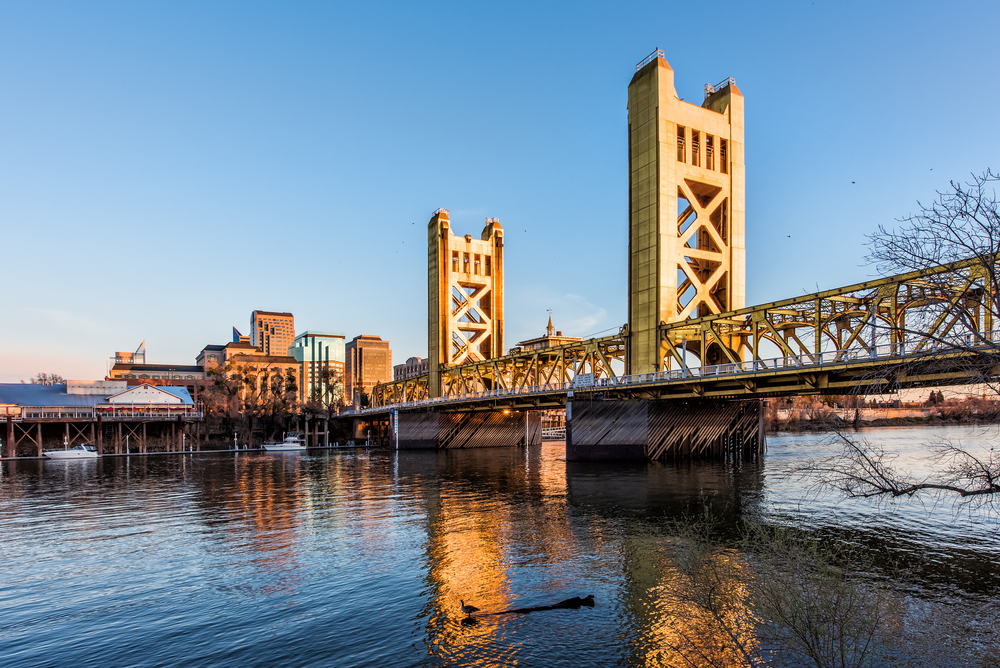
Photo Credit: Andriy Blokhin / Shutterstock
11. Sacramento-Roseville-Folsom, CA
- Percentage of luxury home sales ($1M+): 4.31%
- Median property value for $1M+ homes: $1,255,000
- Median income for $1M+ buyers: $346,000
- Median down payment for $1M+ homes: $400,000

Photo Credit: Nicholas Courtney / Shutterstock
10. Denver-Aurora-Lakewood, CO
- Percentage of luxury home sales ($1M+): 4.98%
- Median property value for $1M+ homes: $1,285,000
- Median income for $1M+ buyers: $300,000
- Median down payment for $1M+ homes: $420,000
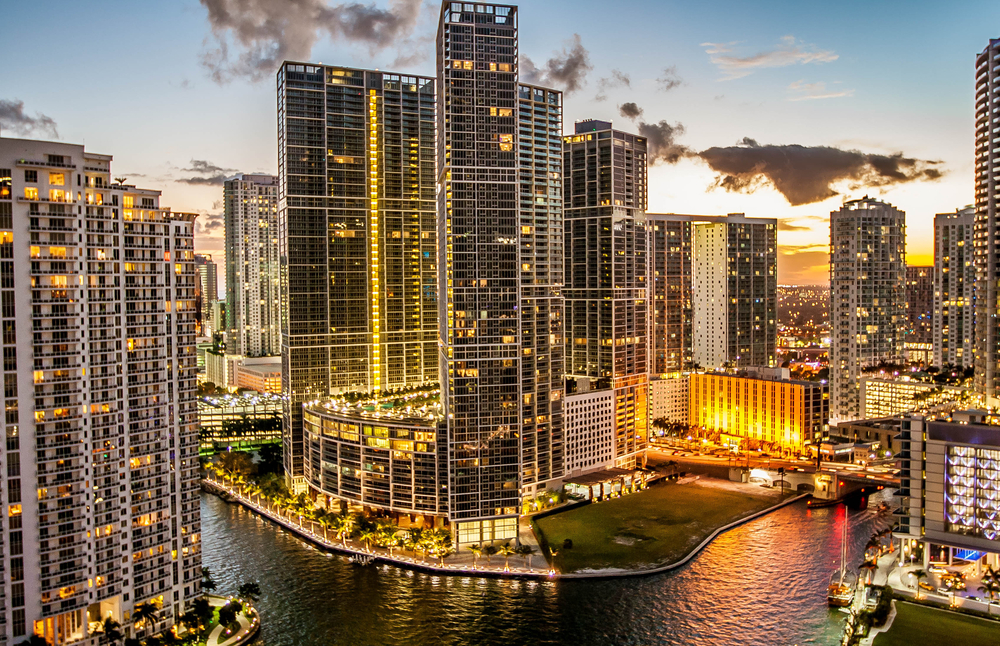
Photo Credit: dorinser / Shutterstock
9. Miami-Fort Lauderdale-Pompano Beach, FL
- Percentage of luxury home sales ($1M+): 6.13%
- Median property value for $1M+ homes: $1,455,000
- Median income for $1M+ buyers: $451,000
- Median down payment for $1M+ homes: $490,000
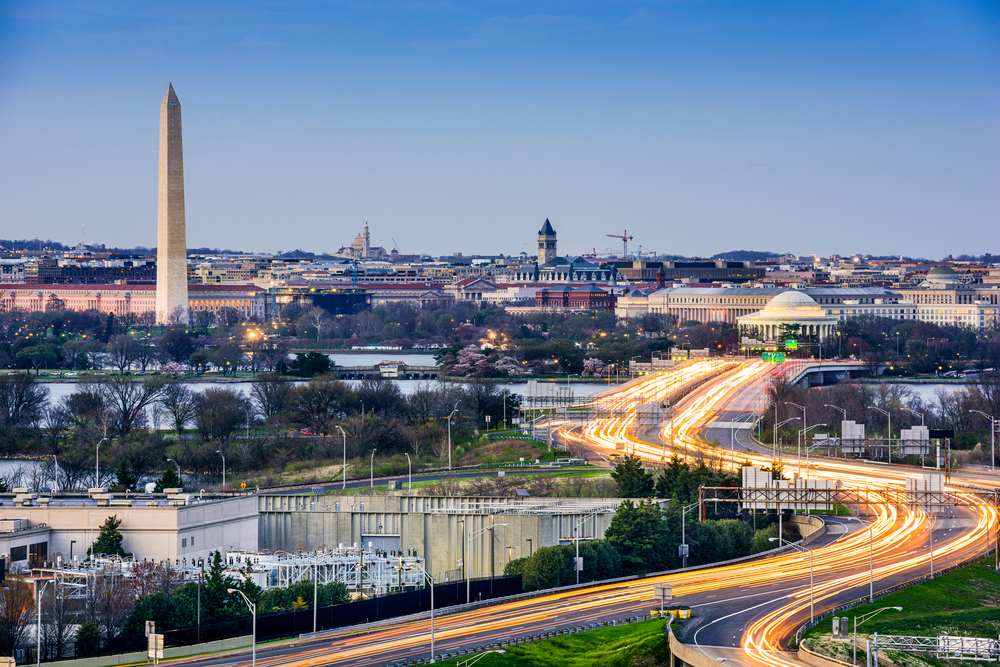
Photo Credit: ESB Professional / Shutterstock
8. Washington-Arlington-Alexandria, DC-VA-MD-WV
- Percentage of luxury home sales ($1M+): 9.01%
- Median property value for $1M+ homes: $1,305,000
- Median income for $1M+ buyers: $311,000
- Median down payment for $1M+ homes: $360,000

Photo Credit: Travellaggio / Shutterstock
7. Boston-Cambridge-Newton, MA-NH
- Percentage of luxury home sales ($1M+): 12.11%
- Median property value for $1M+ homes: $1,355,000
- Median income for $1M+ buyers: $320,000
- Median down payment for $1M+ homes: $400,000

Photo Credit: Victor Moussa / Shutterstock
6. New York-Newark-Jersey City, NY-NJ-PA
- Percentage of luxury home sales ($1M+): 12.28%
- Median property value for $1M+ homes: $1,435,000
- Median income for $1M+ buyers: $378,000
- Median down payment for $1M+ homes: $420,000

Photo Credit: Jeremy Janus / Shutterstock
5. Seattle-Tacoma-Bellevue, WA
- Percentage of luxury home sales ($1M+): 14.70%
- Median property value for $1M+ homes: $1,305,000
- Median income for $1M+ buyers: $272,000
- Median down payment for $1M+ homes: $390,000

Photo Credit: Sean Pavone / Shutterstock
4. San Diego-Chula Vista-Carlsbad, CA
- Percentage of luxury home sales ($1M+): 19.40%
- Median property value for $1M+ homes: $1,375,000
- Median income for $1M+ buyers: $290,500
- Median down payment for $1M+ homes: $430,000

Photo Credit: Chones / Shutterstock
3. Los Angeles-Long Beach-Anaheim, CA
- Percentage of luxury home sales ($1M+): 27.51%
- Median property value for $1M+ homes: $1,405,000
- Median income for $1M+ buyers: $300,000
- Median down payment for $1M+ homes: $430,000

Photo Credit: Bogdan Vacarciuc / Shutterstock
2. San Francisco-Oakland-Berkeley, CA
- Percentage of luxury home sales ($1M+): 49.36%
- Median property value for $1M+ homes: $1,425,000
- Median income for $1M+ buyers: $290,000
- Median down payment for $1M+ homes: $400,000

Photo Credit: Uladzik Kryhin / Shutterstock
1. San Jose-Sunnyvale-Santa Clara, CA
- Percentage of luxury home sales ($1M+): 61.12%
- Median property value for $1M+ homes: $1,455,000
- Median income for $1M+ buyers: $289,000
- Median down payment for $1M+ homes: $400,000
Detailed Findings & Methodology
To determine the metros with the highest percentage of luxury home sales, researchers at Inspection Support Network analyzed the latest data from the Federal Financial Institutions Examination Council’s Home Mortgage Disclosure Act. Only conventional, home purchase loans that originated in 2020 were considered in the analysis. The researchers ranked metro areas by the percentage of mortgaged home sales greater than $1,000,000. In the event of a tie, the metro with the larger median property value for greater than $1,000,000 homes was ranked higher. To improve relevance, only metropolitan areas with at least 100,000 residents were included. Additionally, metros were grouped into cohorts based on population size: small (100,000–349,999), midsize (350,000–999,999), and large (1,000,000 or more).