
Photo Credit: fizkes / Shutterstock
In recent years, public health officials have been trying to raise awareness of the negative effects of a common daily activity: sitting.
While sitting can be helpful for resting and maintaining the body, sitting for prolonged periods with limited physical activity reduces energy expenditure and cardiovascular fitness, which contributes to a number of adverse health conditions. Sitting can increase the likelihood of obesity, blood clots, high blood pressure, high blood sugar, and high cholesterol. It may also increase the risk of heart disease, diabetes, and even cancer. It affects posture, stiffens joints, and contributes to tightness and strain in the back, hamstrings, and hips. With this long list of potential health consequences, some health professionals argue that “sitting is the new smoking.”
One reason that sitting has received increased attention as a public health concern is that people are spending more time sitting while at work. Up until the mid-20th century, much of the economy in the U.S. was centered around jobs in fields like manufacturing and agriculture that required workers to stand and engage in other physical activity. Increasingly, however, the modern economy emphasizes office jobs that are more sedentary in nature. This trend has only accelerated with the adoption of technologies—from phones and faxes to computers and the internet—that allow workers to complete more tasks and communicate with coworkers or customers from their desks. Today there are 83% more sedentary jobs in the U.S. than there were in 1950.
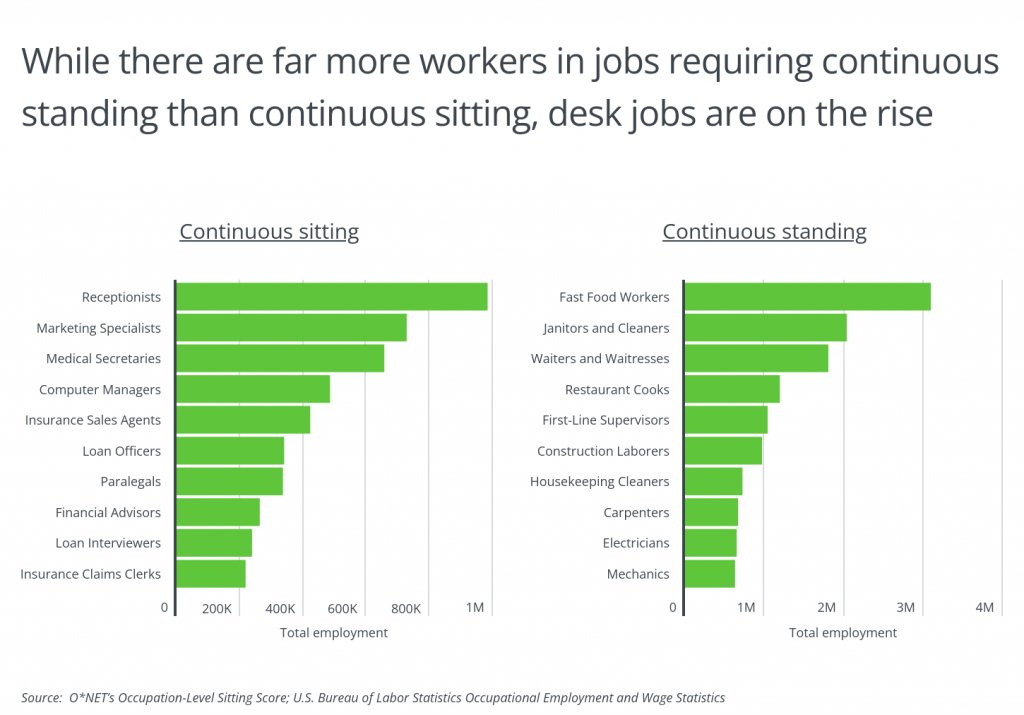
Despite this trend, jobs that require continuous standing do remain more common than jobs that require continuous sitting. There are still nearly three times as many workers in the ten most common professions that require continuous standing than the ten most common professions for continuous sitting, according to data from the U.S. Bureau of Labor Statistics and O*NET. Many of the standing-heavy occupations are concentrated in fields like food service and construction, while the most common seated occupations include professions like receptionists and medical secretaries, jobs in office-based industries like finance, insurance, and law, and fast-growing fields like market research and computer and information systems.
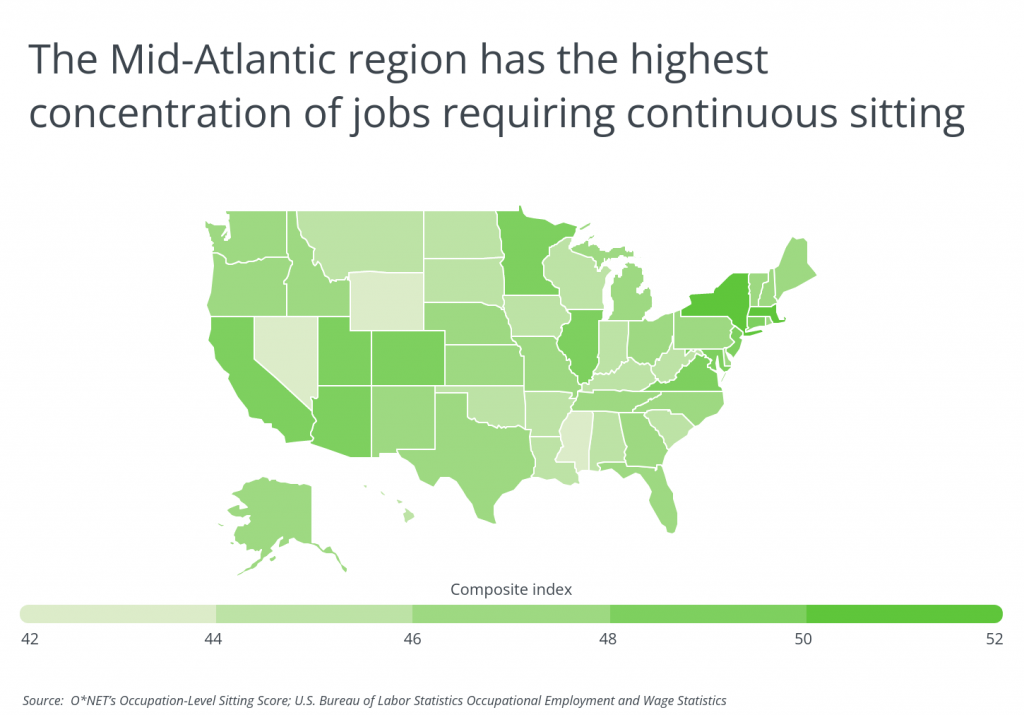
Sitting and standing jobs are not equally common across the U.S. due to differences in locations’ economic makeup. States including Nevada—which has a large hospitality and food service industry—and Mississippi—which has many jobs in agriculture and manufacturing—are the leaders in jobs with continuous standing. Northeastern states like New York, Massachusetts, and Maryland have economies with more workers in fields like finance, professional services, and information technology that are primarily conducted in offices. Accordingly, those states lead the nation in concentrations of workers who sit continuously.
Cities in those leading states, like New York, Boston, and the D.C. metro, are also among the leading locations for primarily seated jobs at the local level. But one other sign that a metro will have more workers who sit is a strong tech industry. High-tech hotspots like the Bay Area, Austin, and Seattle all rank highly on the list of cities with the most workers who sit.
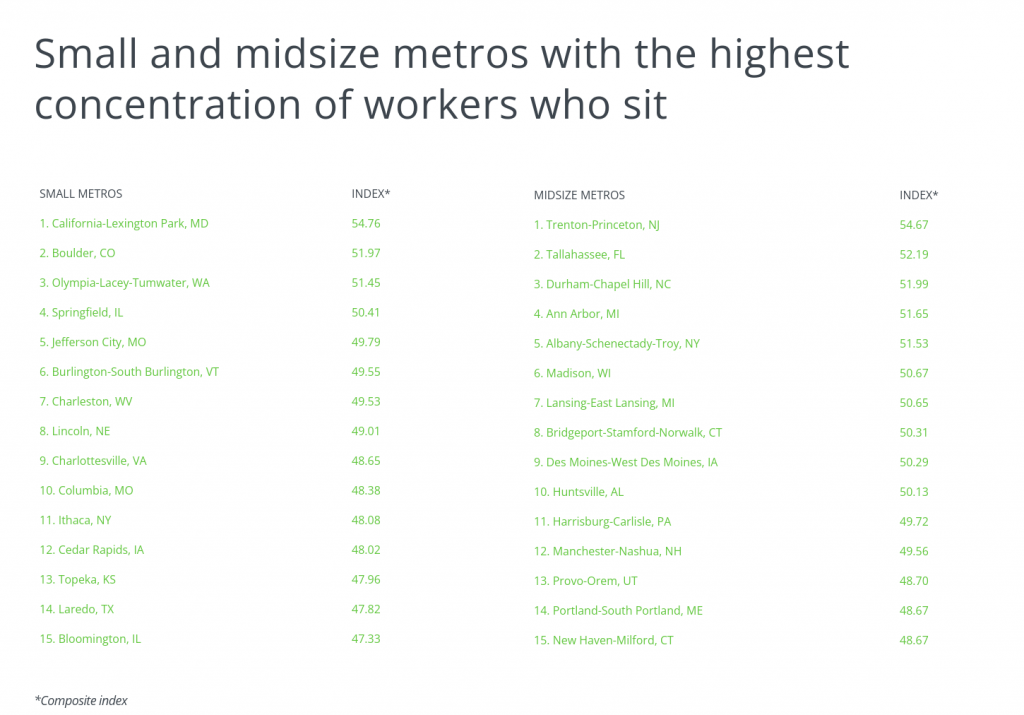
The data used in this analysis is from O*NET’s Occupation-Level Sitting Score and the U.S. Bureau of Labor Statistics Occupational Employment and Wage Statistics. To determine the locations with the highest concentration of workers who sit, researchers at HireAHelper calculated a composite index, combining each location’s occupational mix with each occupation’s sitting score. In the event of a tie, the location with the greater share of workers in jobs requiring continuous sitting—those with an O*NET score of 90 or above—was ranked higher. To improve relevance, only metropolitan areas with at least 100,000 residents were included.
Here are the cities with the highest concentration of workers who sit.
Large Metros With the Highest Concentration of Workers Who Sit
Photo Credit: Andriy Blokhin / Shutterstock
15. Sacramento-Roseville-Folsom, CA
- Composite index: 49.62
- Share of workers in jobs requiring continuous sitting: 5.2%
- Share of workers in jobs requiring continuous standing: 12.5%
- Total workers in jobs requiring continuous sitting: 51,220
- Total workers in jobs requiring continuous standing: 122,450

Photo Credit: Gregory E. Clifford / Shutterstock
14. Phoenix-Mesa-Chandler, AZ
- Composite index: 49.62
- Share of workers in jobs requiring continuous sitting: 6.8%
- Share of workers in jobs requiring continuous standing: 12.1%
- Total workers in jobs requiring continuous sitting: 143,740
- Total workers in jobs requiring continuous standing: 255,610
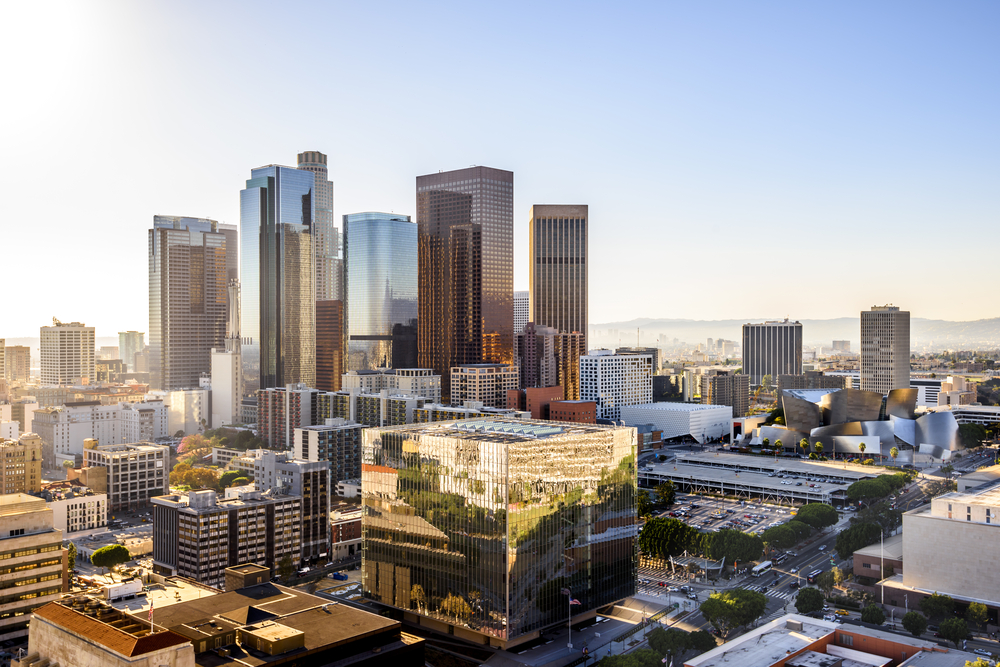
Photo Credit: Chones / Shutterstock
13. Los Angeles-Long Beach-Anaheim, CA
- Composite index: 49.77
- Share of workers in jobs requiring continuous sitting: 5.9%
- Share of workers in jobs requiring continuous standing: 11.4%
- Total workers in jobs requiring continuous sitting: 337,840
- Total workers in jobs requiring continuous standing: 651,310
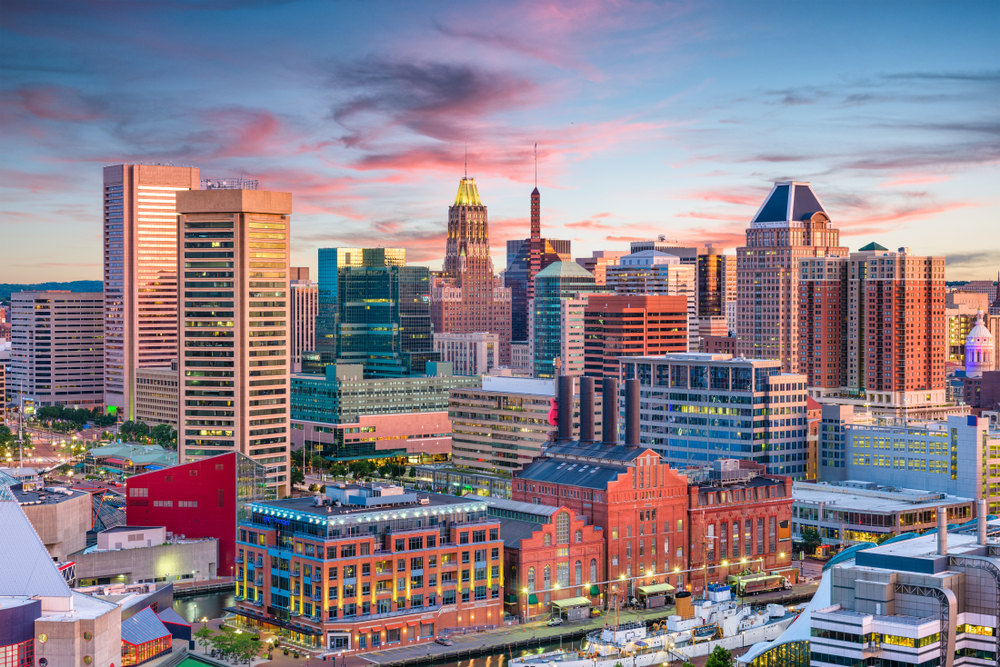
Photo Credit: Sean Pavone / Shutterstock
12. Baltimore-Columbia-Towson, MD
- Composite index: 49.81
- Share of workers in jobs requiring continuous sitting: 5.9%
- Share of workers in jobs requiring continuous standing: 11.7%
- Total workers in jobs requiring continuous sitting: 73,510
- Total workers in jobs requiring continuous standing: 146,520

Photo Credit: photo.ua / Shutterstock
11. Minneapolis-St. Paul-Bloomington, MN-WI
- Composite index: 50.23
- Share of workers in jobs requiring continuous sitting: 6.1%
- Share of workers in jobs requiring continuous standing: 11.5%
- Total workers in jobs requiring continuous sitting: 111,310
- Total workers in jobs requiring continuous standing: 209,130
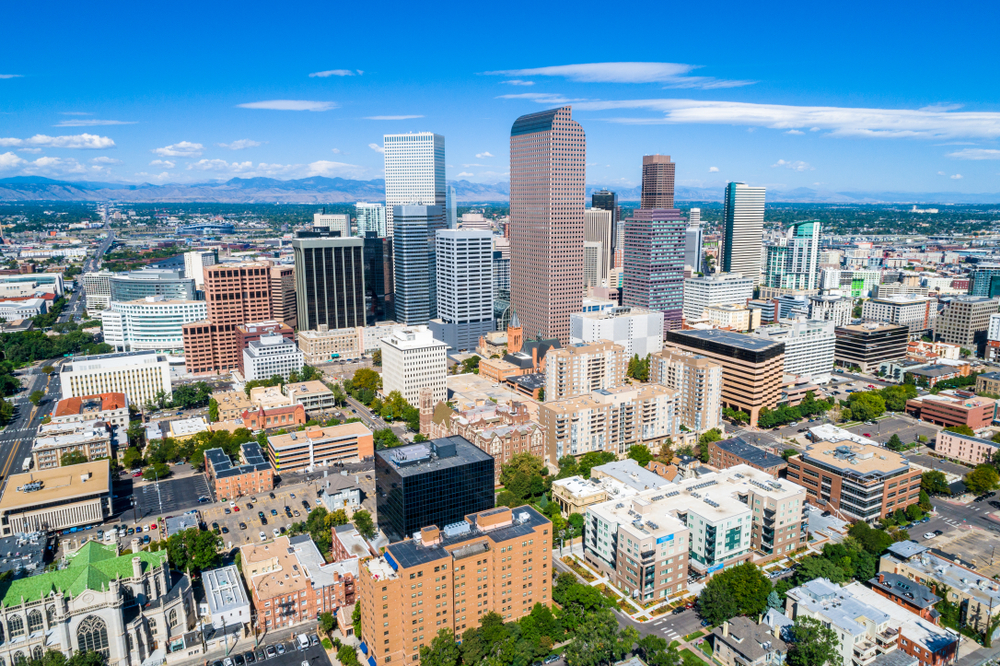
Photo Credit: Roschetzky Photography / Shutterstock
10. Denver-Aurora-Lakewood, CO
- Composite index: 50.32
- Share of workers in jobs requiring continuous sitting: 6.5%
- Share of workers in jobs requiring continuous standing: 12.1%
- Total workers in jobs requiring continuous sitting: 95,220
- Total workers in jobs requiring continuous standing: 177,500
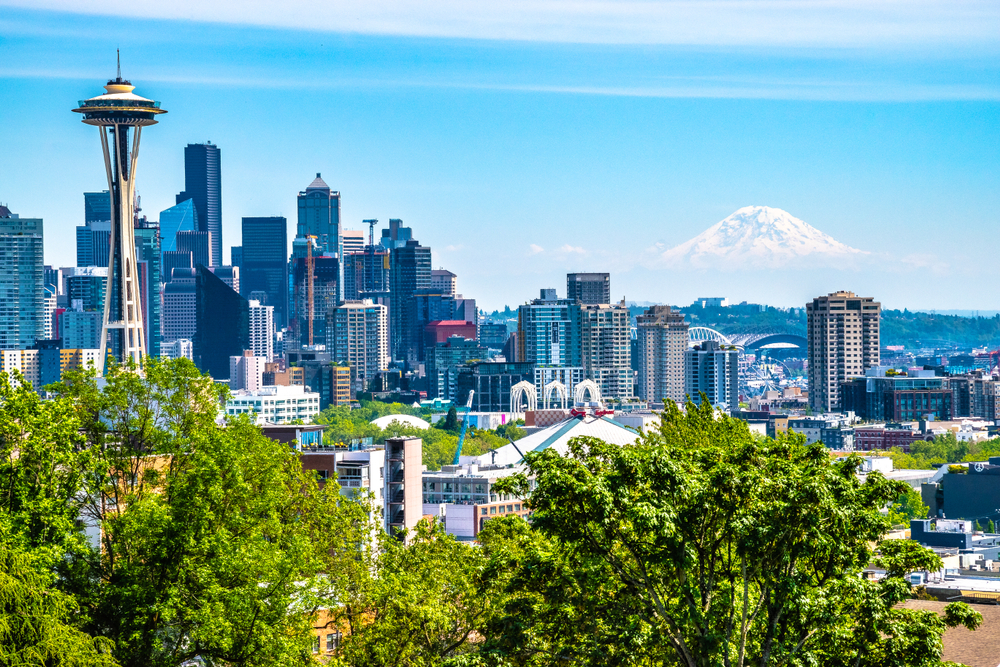
Photo Credit: Jeremy Janus / Shutterstock
9. Seattle-Tacoma-Bellevue, WA
- Composite index: 50.64
- Share of workers in jobs requiring continuous sitting: 6.3%
- Share of workers in jobs requiring continuous standing: 12.1%
- Total workers in jobs requiring continuous sitting: 120,020
- Total workers in jobs requiring continuous standing: 232,540

Photo Credit: Jon Bilous / Shutterstock
8. Hartford-East Hartford-Middletown, CT
- Composite index: 51.03
- Share of workers in jobs requiring continuous sitting: 6.5%
- Share of workers in jobs requiring continuous standing: 10.0%
- Total workers in jobs requiring continuous sitting: 35,130
- Total workers in jobs requiring continuous standing: 54,370
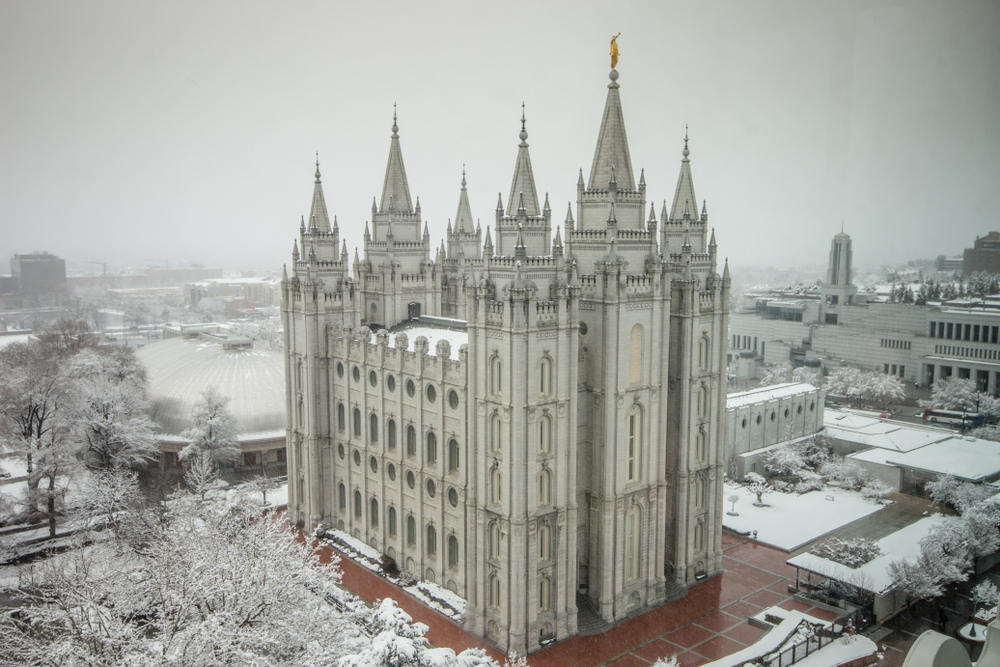
Photo Credit: Globe Guide Media Inc / Shutterstock
7. Salt Lake City, UT
- Composite index: 51.34
- Share of workers in jobs requiring continuous sitting: 6.6%
- Share of workers in jobs requiring continuous standing: 11.7%
- Total workers in jobs requiring continuous sitting: 49,410
- Total workers in jobs requiring continuous standing: 86,700
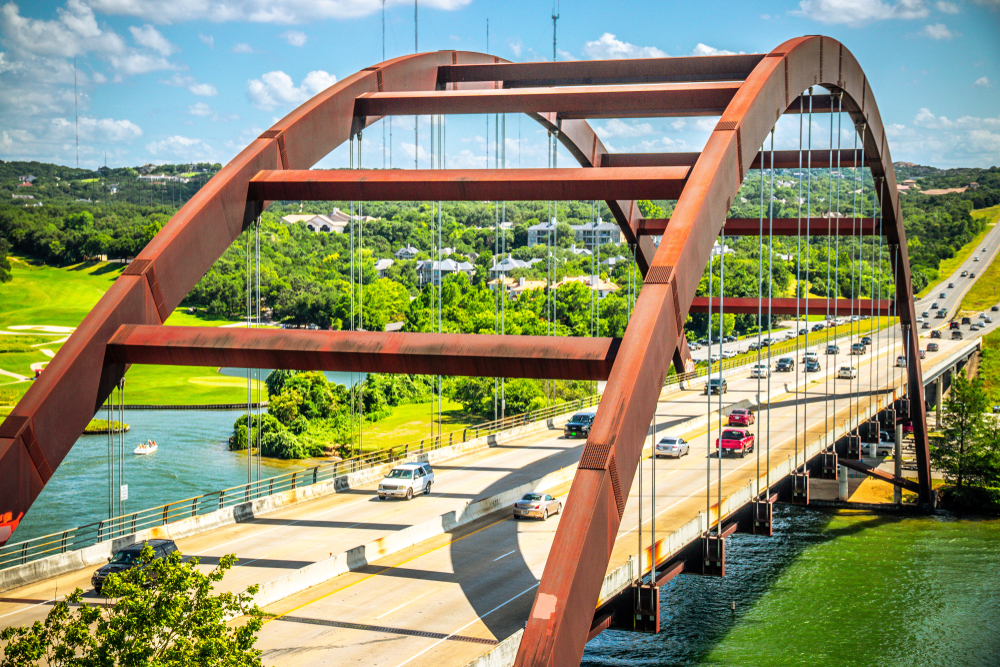
Photo Credit: ShengYing Lin / Shutterstock
6. Austin-Round Rock-Georgetown, TX
- Composite index: 51.52
- Share of workers in jobs requiring continuous sitting: 6.7%
- Share of workers in jobs requiring continuous standing: 12.4%
- Total workers in jobs requiring continuous sitting: 71,840
- Total workers in jobs requiring continuous standing: 132,560

Photo Credit: Ingus Kruklitis / Shutterstock
5. New York-Newark-Jersey City, NY-NJ-PA
- Composite index: 51.67
- Share of workers in jobs requiring continuous sitting: 6.6%
- Share of workers in jobs requiring continuous standing: 10.5%
- Total workers in jobs requiring continuous sitting: 569,830
- Total workers in jobs requiring continuous standing: 915,440
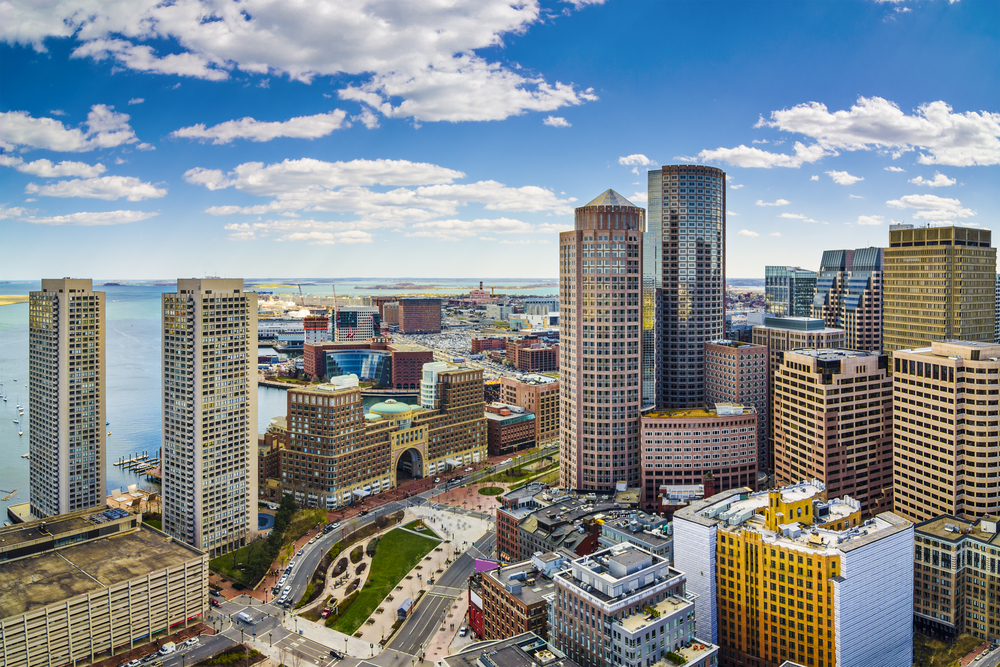
Photo Credit: ESB Professional / Shutterstock
4. Boston-Cambridge-Newton, MA-NH
- Composite index: 51.93
- Share of workers in jobs requiring continuous sitting: 6.1%
- Share of workers in jobs requiring continuous standing: 10.8%
- Total workers in jobs requiring continuous sitting: 156,970
- Total workers in jobs requiring continuous standing: 278,950

Photo Credit: yhelfman / Shutterstock
3. San Francisco-Oakland-Berkeley, CA
- Composite index: 52.28
- Share of workers in jobs requiring continuous sitting: 7.2%
- Share of workers in jobs requiring continuous standing: 10.6%
- Total workers in jobs requiring continuous sitting: 160,430
- Total workers in jobs requiring continuous standing: 236,880

Photo Credit: f11photo / Shutterstock
2. Washington-Arlington-Alexandria, DC-VA-MD-WV
- Composite index: 53.80
- Share of workers in jobs requiring continuous sitting: 6.4%
- Share of workers in jobs requiring continuous standing: 11.0%
- Total workers in jobs requiring continuous sitting: 186,320
- Total workers in jobs requiring continuous standing: 321,290
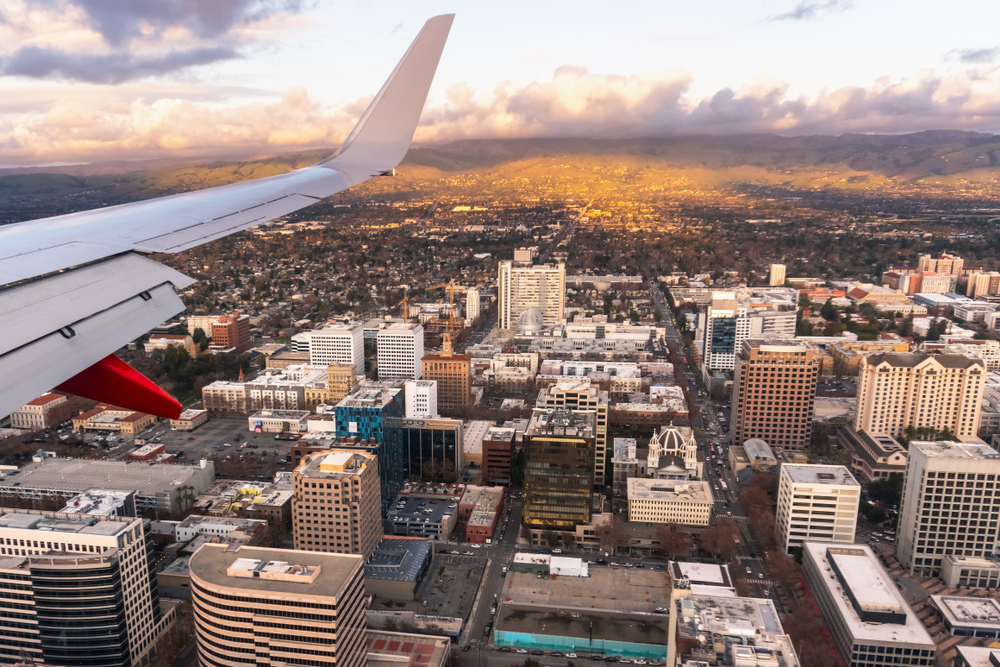
Photo Credit: Sundry Photography / Shutterstock
1. San Jose-Sunnyvale-Santa Clara, CA
- Composite index: 54.02
- Share of workers in jobs requiring continuous sitting: 7.5%
- Share of workers in jobs requiring continuous standing: 9.2%
- Total workers in jobs requiring continuous sitting: 79,810
- Total workers in jobs requiring continuous standing: 98,760
Detailed Findings & Methodology
The data used in this analysis is from O*NET’s Occupation-Level Sitting Score and the U.S. Bureau of Labor Statistics Occupational Employment and Wage Statistics. To determine the locations with the highest concentration of workers who sit, researchers calculated a composite index, which is an employment-weighted average of each occupation’s O*NET sitting score for each location. In the event of a tie, the location with the greater share of workers in jobs requiring continuous sitting—those with an O*NET score of 90 or above—was ranked higher. To improve relevance, only metropolitan areas with at least 100,000 residents were included. Additionally, metros were grouped into cohorts based on population size: small (100,000–349,999), midsize (350,000–999,999), and large (1,000,000 or more).