
Photo Credit: Aleksandar Malivuk / Shutterstock
With numerous economic experts predicting that the U.S. is headed toward recession, one of the many concerning signals is a sharp decline in labor productivity.
After more than a decade of below-average productivity growth, the COVID-19 pandemic raised the prospect of a productivity boom. Many low-productivity jobs were eliminated early in the pandemic, while major infrastructure investments and the accelerated adoption of automation and artificial intelligence created conditions for productivity to rise.
But more recent data has shown productivity declining. The Bureau of Labor Statistics reported a 7.5% decline in labor productivity during the first quarter of 2022, the steepest decline since 1947.
Productivity is a useful metric for assessing the economy because it reflects the economy’s ability to generate goods and services from the same amount of work. Productivity growth can simultaneously benefit businesses through increased profits, consumers through increased availability of goods and services, and workers through increased compensation.
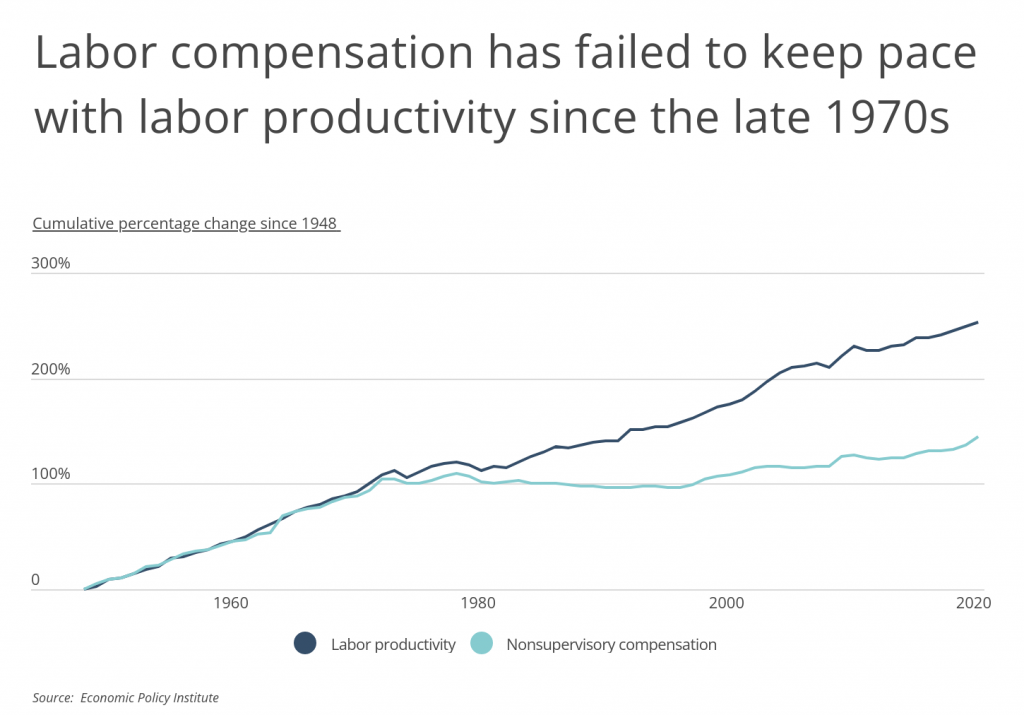
In recent decades, however, the link between productivity growth and wage growth has weakened. Experts term this phenomenon the “productivity-pay gap.” From the late 1940s to the late 1970s, the cumulative growth for both labor productivity and compensation for nonsupervisory employees closely tracked one another. But beginning in the late 1970s, the growth rate for compensation began to level out, even as labor productivity continued to increase. The cumulative percentage change in productivity since the late 1940s is 253%, while wages have grown by only 144% over the same span.
One of the critical factors that has impacted productivity trends is industry. Research from the Bureau of Labor Statistics has found that many of the industries with large productivity-pay gaps are those that have also seen the largest gains in productivity in recent decades. Sectors like manufacturing have improved their productivity through automation and by offshoring jobs to less expensive labor markets. Meanwhile, technology-based industries like computer manufacturers and software publishers saw an explosion of innovation in the late 20th and earlier 21st century that contributed to rapid growth.
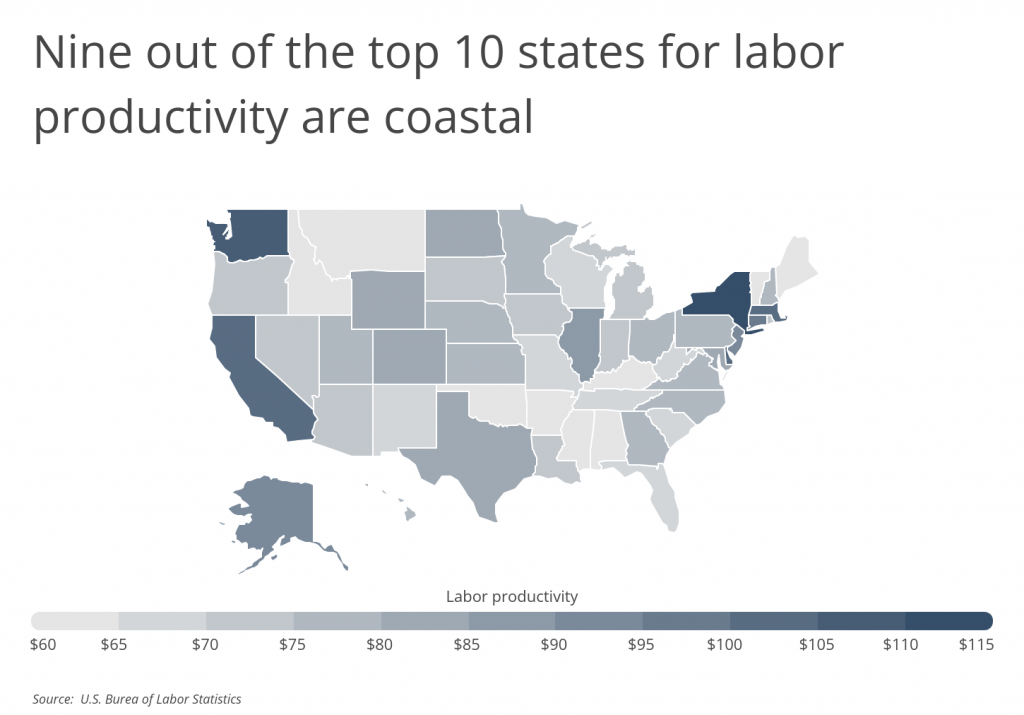
Gaps in productivity are also apparent across geographies. The Northeast and West have states that tend to be more productive than the U.S. as a whole. These states have advantages in the determinants of overall economic productivity that help contribute to their high labor productivity levels. For example, the technology-heavy industry makeup of Washington and California, the availability of capital and financing in New York, and the high educational attainment levels in Massachusetts all contribute to these states’ strong labor productivity.
The data used in this analysis is from the U.S. Bureau of Labor Statistics Office of Productivity and Technology (OPT). To determine the states with the greatest labor productivity, researchers at Smartest Dollar divided each state’s total value-added output by its total annual hours worked. In the event of a tie, the state with the greater value-added output was ranked above. All data shown is for private, nonfarm industries in 2021. Value-added output is defined as gross output minus intermediate inputs (such as energy, material, and services). A complete set of definitions can be found at the BLS glossary page.
Here are the states with the greatest labor productivity.
States With the Greatest Labor Productivity

Photo Credit: Sean Pavone / Shutterstock
15. Pennsylvania
- Labor productivity: $79.26
- Total value-added output: $702,670,372,000
- Total employment: 5,392,400
- Average annual hours per worker: 1,644

Photo Credit: Sean Pavone / Shutterstock
14. Texas
- Labor productivity: $80.54
- Total value-added output: $1,640,004,984,000
- Total employment: 11,749,000
- Average annual hours per worker: 1,733

Photo Credit: Jess Kraft / Shutterstock
13. Wyoming
- Labor productivity: $80.62
- Total value-added output: $31,586,315,000
- Total employment: 233,400
- Average annual hours per worker: 1,679

Photo Credit: Real Window Creative / Shutterstock
12. North Dakota
- Labor productivity: $82.06
- Total value-added output: $48,299,490,000
- Total employment: 353,500
- Average annual hours per worker: 1,665

Photo Credit: photo.ua / Shutterstock
11. Colorado
- Labor productivity: $82.26
- Total value-added output: $334,379,906,000
- Total employment: 2,540,100
- Average annual hours per worker: 1,600

Photo Credit: grandbrothers / Shutterstock
10. Maryland
- Labor productivity: $82.34
- Total value-added output: $310,204,445,000
- Total employment: 2,313,200
- Average annual hours per worker: 1,629

Photo Credit: Oleg Podzorov / Shutterstock
9. Illinois
- Labor productivity: $88.42
- Total value-added output: $778,025,075,000
- Total employment: 5,326,200
- Average annual hours per worker: 1,652

Photo Credit: dani3315 / Shutterstock
8. Alaska
- Labor productivity: $90.44
- Total value-added output: $39,763,770,000
- Total employment: 262,600
- Average annual hours per worker: 1,674

Photo Credit: Sean Pavone / Shutterstock
7. New Jersey
- Labor productivity: $91.21
- Total value-added output: $548,008,610,000
- Total employment: 3,655,500
- Average annual hours per worker: 1,644

Photo Credit: JMcQ / Shutterstock
6. Connecticut
- Labor productivity: $98.65
- Total value-added output: $247,743,547,000
- Total employment: 1,538,800
- Average annual hours per worker: 1,632

Photo Credit: CO Leong / Shutterstock
5. Massachusetts
- Labor productivity: $100.72
- Total value-added output: $533,657,907,000
- Total employment: 3,288,900
- Average annual hours per worker: 1,611

Photo Credit: Matt Gush / Shutterstock
4. California
- Labor productivity: $103.30
- Total value-added output: $2,729,409,518,000
- Total employment: 15,875,600
- Average annual hours per worker: 1,664

Photo Credit: Jon Bilous / Shutterstock
3. Delaware
- Labor productivity: $104.53
- Total value-added output: $66,888,567,000
- Total employment: 404,900
- Average annual hours per worker: 1,580

Photo Credit: ESB Professional / Shutterstock
2. Washington
- Labor productivity: $106.09
- Total value-added output: $536,309,572,000
- Total employment: 3,071,500
- Average annual hours per worker: 1,646

Photo Credit: Ingus Kruklitis / Shutterstock
1. New York
- Labor productivity: $117.86
- Total value-added output: $1,530,281,417,000
- Total employment: 8,106,800
- Average annual hours per worker: 1,602
Methodology & Detailed Findings
The data used in this analysis is from the U.S. Bureau of Labor Statistics Office of Productivity and Technology (OPT). To determine the states with the greatest labor productivity, researchers divided each state’s total value-added output by its total annual hours worked. In the event of a tie, the state with the greater value-added output was ranked above. All data shown is for private, nonfarm industries in 2021. Value-added output is defined as gross output minus intermediate inputs (such as energy, material, and services). A complete set of definitions can be found at the BLS glossary page.