The U.S. housing market has long followed seasonal patterns, with home prices often rising in the spring and summer as warmer weather and the end of the school year spur more buying and selling activity. In contrast, fall and winter typically see fewer transactions and lower prices as demand softens. These predictable cycles have historically influenced home prices and sales volume throughout the year, offering attractive opportunities for buyers or sellers who time the market right.
However, the COVID-19 pandemic disrupted these patterns. Low mortgage rates, heightened demand, and shifting preferences for larger homes during the remote work era fueled a year-round surge in prices, with many cities experiencing minimal seasonal slowdowns. As the market stabilizes from these major disruptions, some areas are returning to pre-pandemic norms, while others continue to see a significant divergence from typical price patterns.
Seasonal Fluctuations in Home Sales and Price
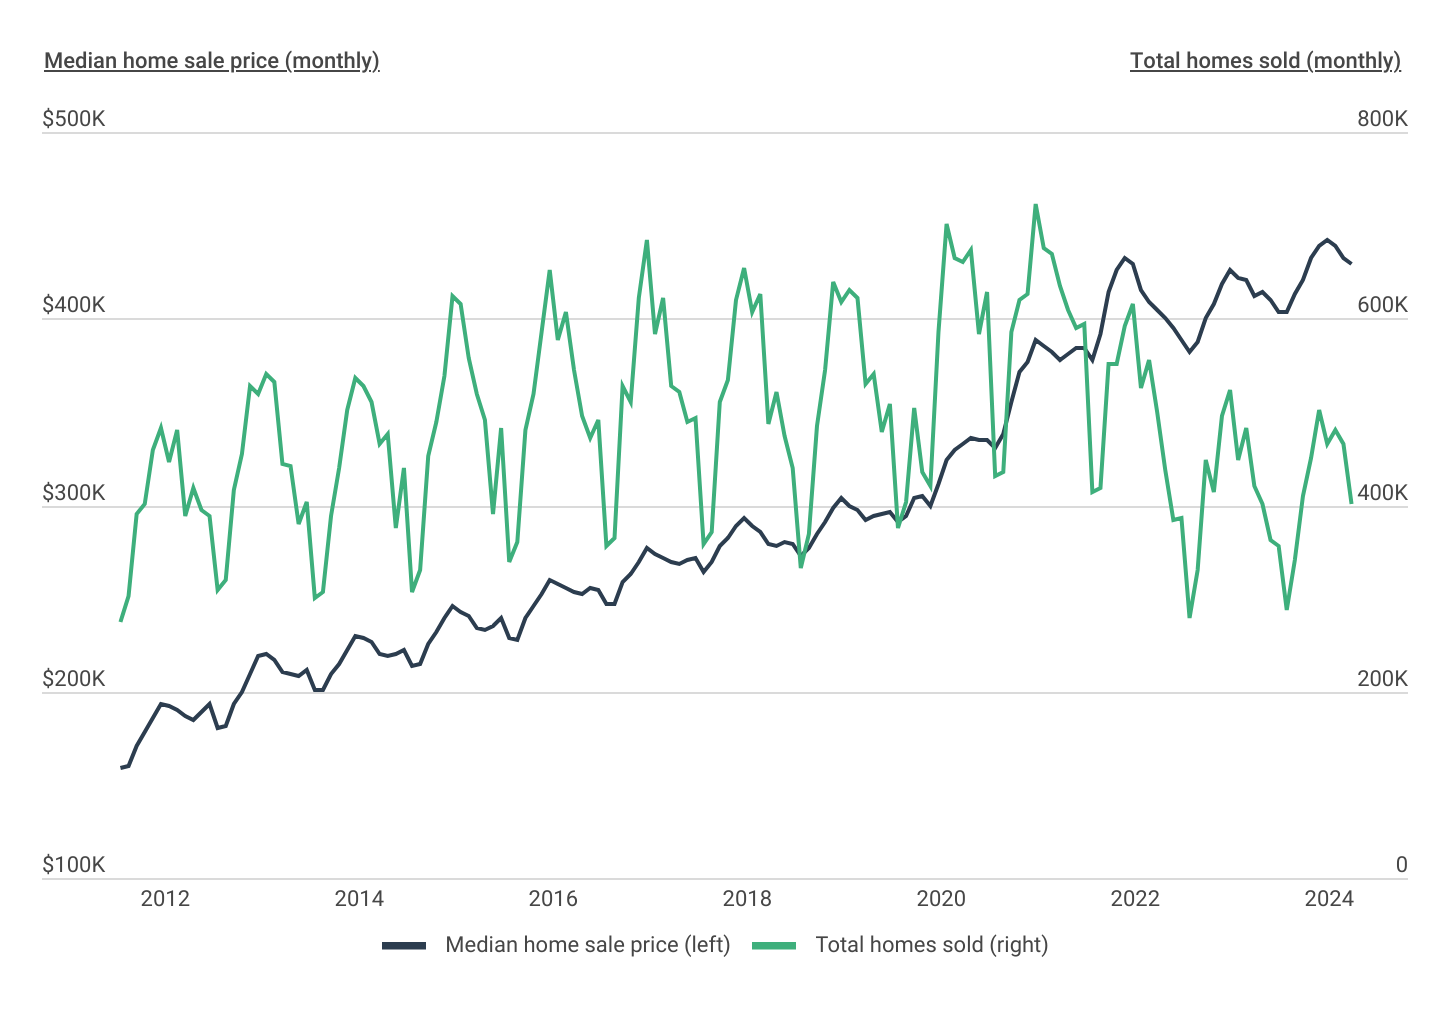
The seasonal impact on the U.S. housing market can be seen in both home sales and sale price
Source: Construction Coverage analysis of Redfin data | Image Credit: Construction Coverage
When the COVID-19 pandemic first struck in March 2020, home sales began to decline during a period when the market typically picks up. However, by mid-2020, sales had quickly rebounded, topping 700,000 homes sold in July 2020 and nearly reaching 725,000 homes sold in June 2021—the highest mark in over a decade. Since then, inflation-driven interest rate hikes have cooled the housing market, and by September 2024, home sales volume had dropped to just over 400,000.
The absence of seasonality was even more noticeable in home price trends. During the pandemic, national median home values remained flat or continued rising in the winter months, when prices usually decline. More recently though, high prices and interest rates have tempered the market, and seasonality has returned. In 2022, the summer-to-winter decline in prices was 11.6%—aligning with the 10-year average of 11.5% (excluding 2020 and 2021)—and in 2023, the seasonal decline was 5.1%.
Seasonal Temperature Change Across the Country
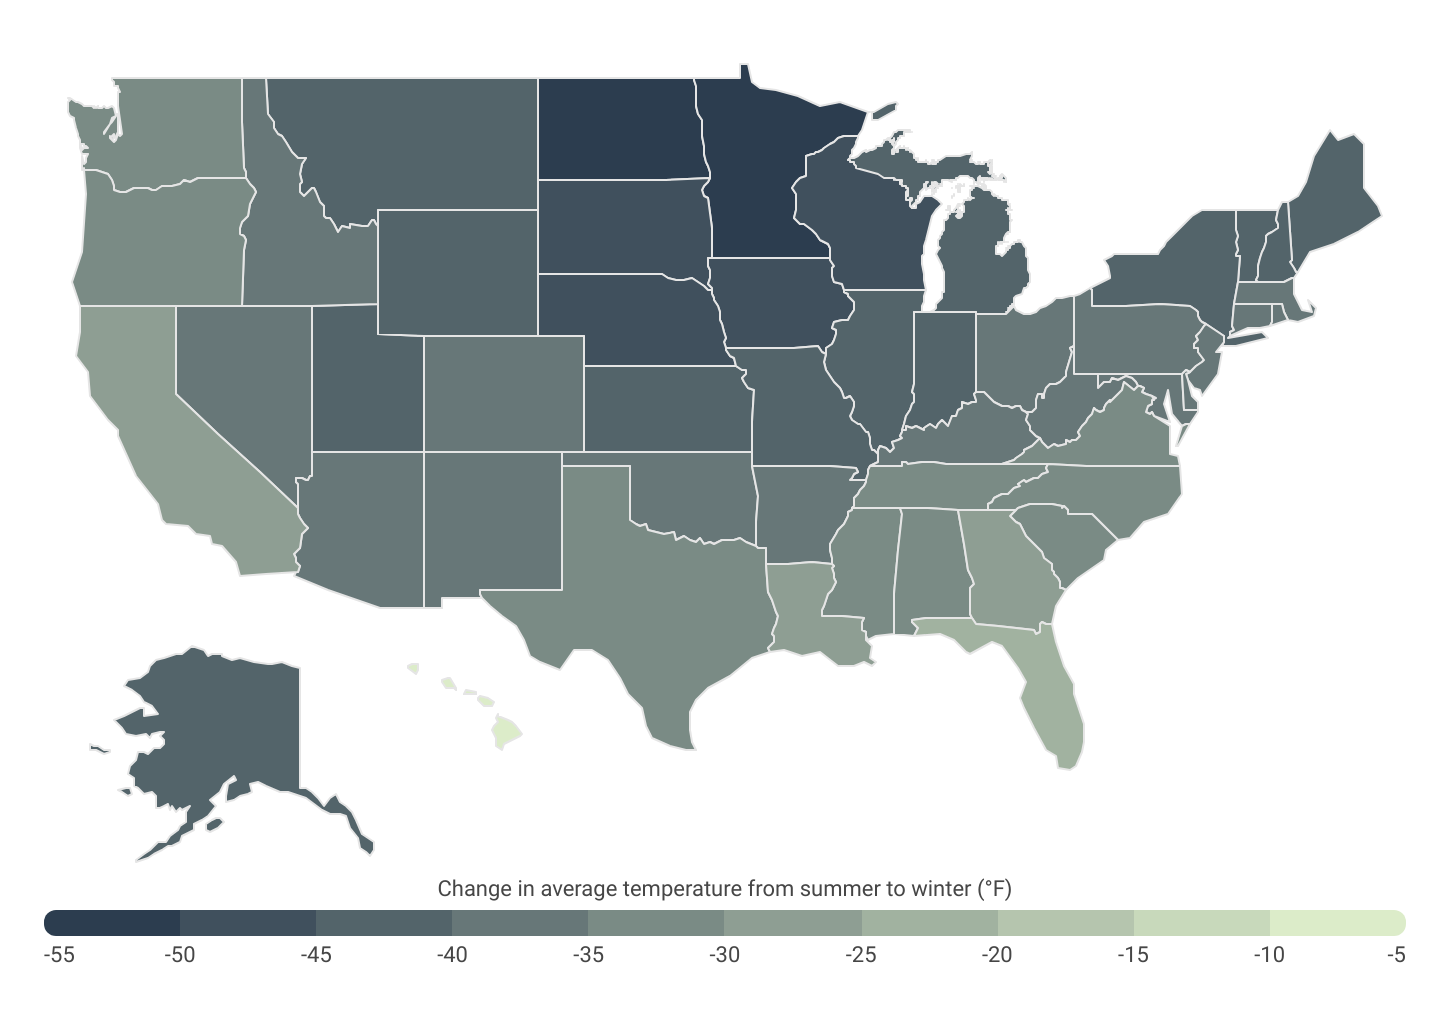
Midwestern and Northeastern states have the most pronounced seasonal temperature shifts in the U.S.
Source: Construction Coverage analysis of NOAA National Centers for Environmental Information data | Image Credit: Construction Coverage
One major reason for seasonality in the real estate market is weather. Cold and wintry conditions can make it hazardous or simply undesirable for buyers to travel to tours, and sellers know that homes have more curb appeal when flowers are in bloom and lawns are lush.
Real estate seasonality can be more pronounced in locations that have especially dramatic transitions between summer and winter months, like the upper Midwest and Northeast. States in these regions can have average summer and winter temperatures that vary by more than 40 degrees Fahrenheit measured from 2014 through 2023—or even more, in the cases of North Dakota (53.2 °F) and Minnesota (52.6 °F).
Geographical Differences in Home Sale Price Seasonality
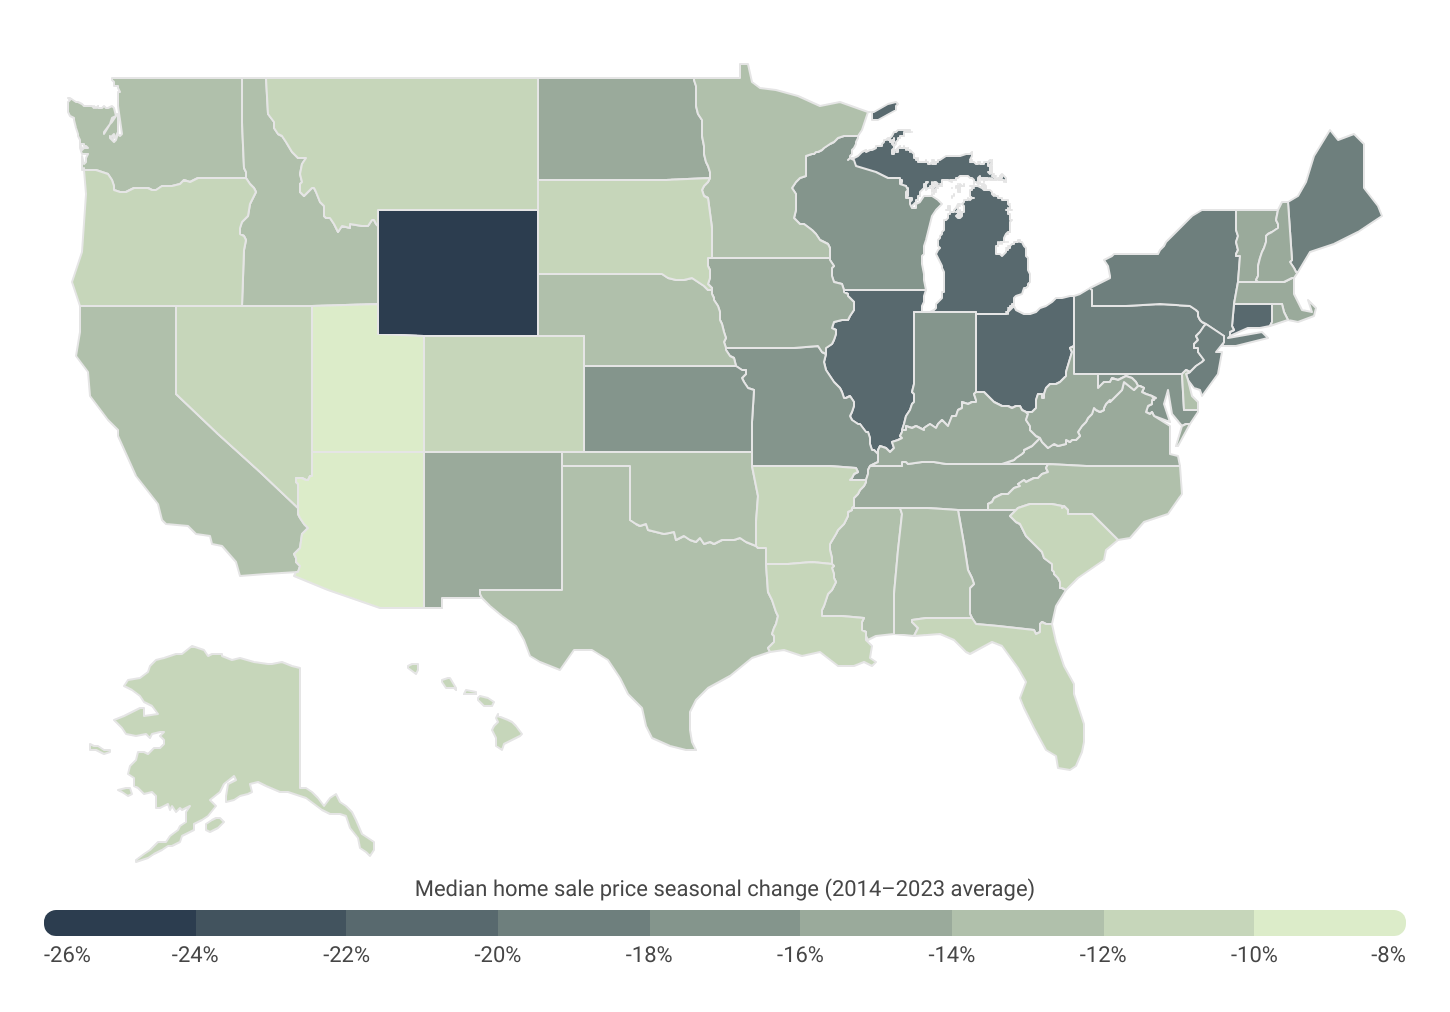
Wyoming and states in the Midwest and Northeast experience the largest seasonal changes in home prices
Source: Construction Coverage analysis of Redfin data | Image Credit: Construction Coverage
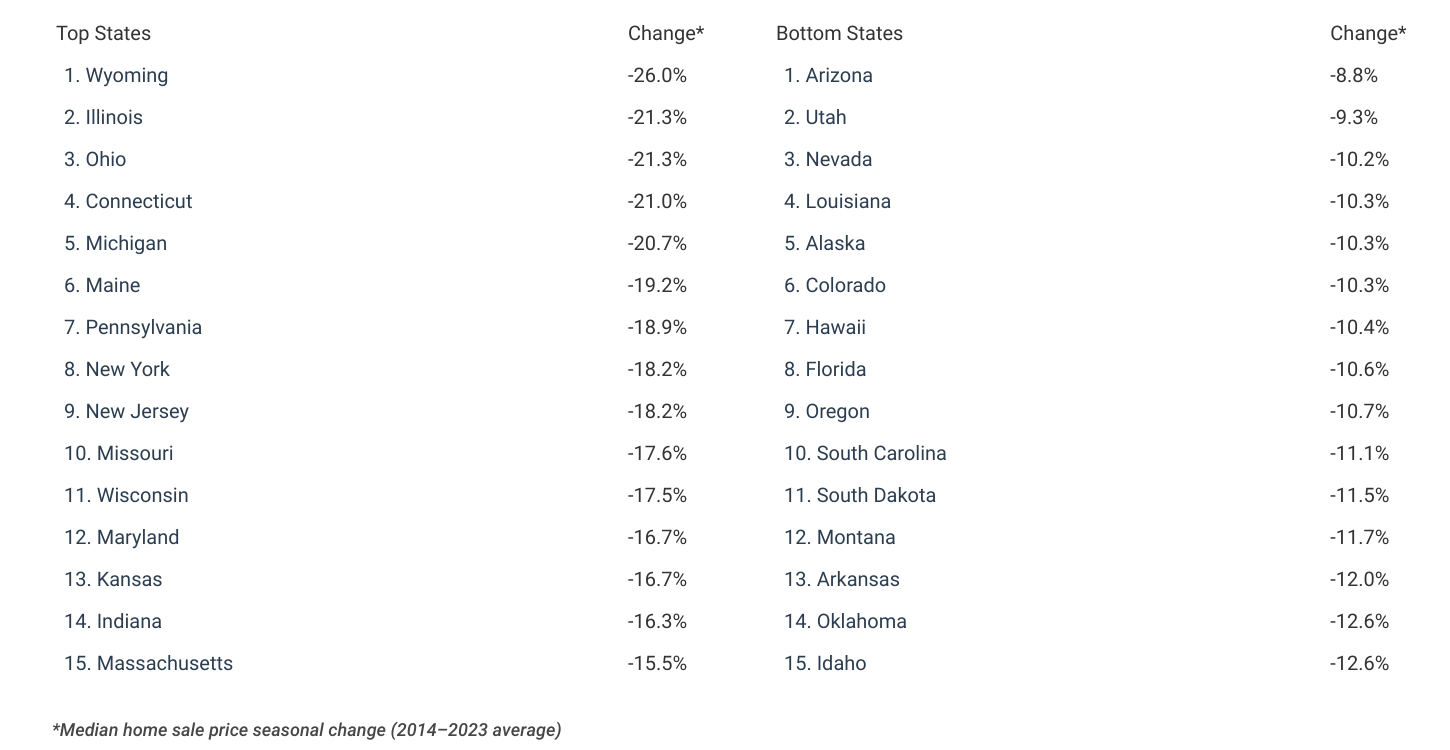
As such, most of the locations that have the greatest seasonal changes in home prices are found around the Great Lakes and in the Northeast. Illinois, Ohio, and Michigan—which all have notably harsh winters—all rank in the top five with average seasonal home price variations from 2014 to 2023 of over 20%. Mountain West and Sun Belt states tend to show less variation, led by Arizona with just an 8.8% difference between summer and winter sales prices. While many of the locations with less variation have temperate climates year-round, another factor may be competition. These states have also been fast-growing in recent years, and as a result, may have more consistent demand for homes across the seasons. Additionally, these states tend to attract visitors in the winter months—whether it be to participate in winter sports (as is the case for Colorado and Utah) or to enjoy warmer weather (as is the case for Arizona, Hawaii, and Florida).
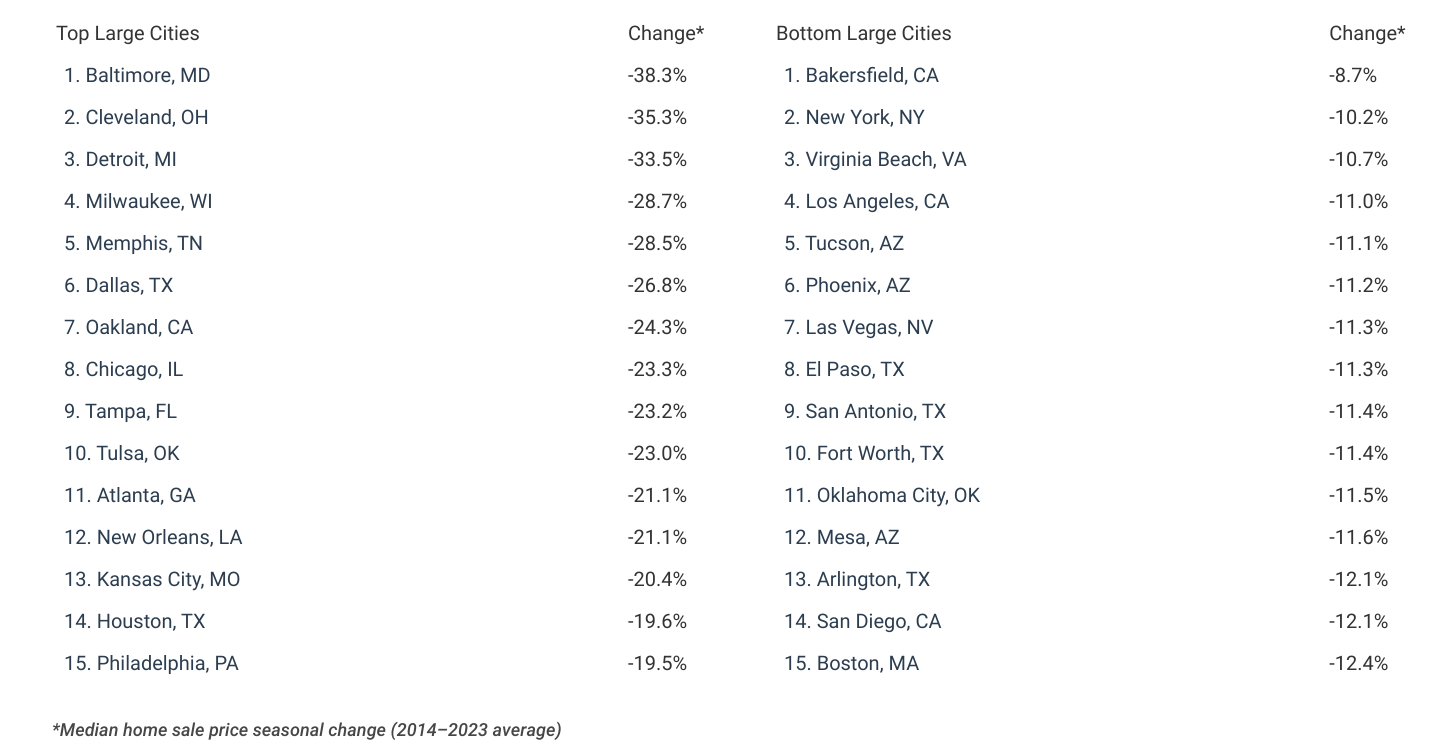
The Great Lakes are also well-represented in the list of metros with the biggest seasonal changes in home prices. Four of the top 10 large cities with the biggest seasonal changes are found in the Great Lakes region, with Cleveland, OH (-35.3%) experiencing a seasonal home sales price variation more than three times the national average of -11.5%.
Below is a breakdown of the top and bottom large cities and states for home sales price seasonality. Researchers from Construction Coverage—a website that compares construction software and insurance—used data from Redfin, and for the complete analysis and more information on how each statistic was computed, see the original analysis Cities With the Biggest Seasonal Changes in Home Prices on Construction Coverage.
Cities With the Biggest Seasonal Changes in Home Price
States With the Biggest Seasonal Changes in Home Price
Detailed Findings & Methodology

Photo Credit: Roschetzky Photography / Shutterstock
The data used in this analysis is from Redfin’s Data Center. To determine the locations with the biggest seasonal changes in home prices, researchers at Construction Coverage calculated the average of the differences between the highest and lowest median home sale months from 2014 through 2023. Due to the anomalous nature of home sales during 2020 and 2021, data from those years were omitted. Locations with bigger seasonal changes were ranked higher, and in the event of a tie, the location with the greater total days on market seasonal change was ranked higher. To improve relevance, only cities with sufficient data and an annual average of more than 1,500 homes sold were included in the analysis, and cities were grouped into cohorts based on population size: small (under 150,000), midsize (150,000–350,000), and large (over 350,000).
For complete results, see Cities With the Biggest Seasonal Changes in Home Prices on Construction Coverage.
