
Photo Credit: DGLimages / Shutterstock
The millennial generation is now America’s largest, numbering 72.1 million, and at ages 26 to 41, fully in the primes of their lives. As the millennials hit more major milestones of adulthood, it is becoming evident how the generation is fundamentally reshaping many aspects of life and society in the U.S.
Family life has been one significant area where millennials’ tendencies have diverged from those of earlier generations. Only 44% of millennials are married, and millennials have continued a long-running trend of delaying marriage, with the median age of first marriage currently sitting at 30.4 for men and 28.6 for women. But millennials also increasingly have different romantic and family arrangements, being more likely than previous generations to live with a partner or have children outside of marriage.
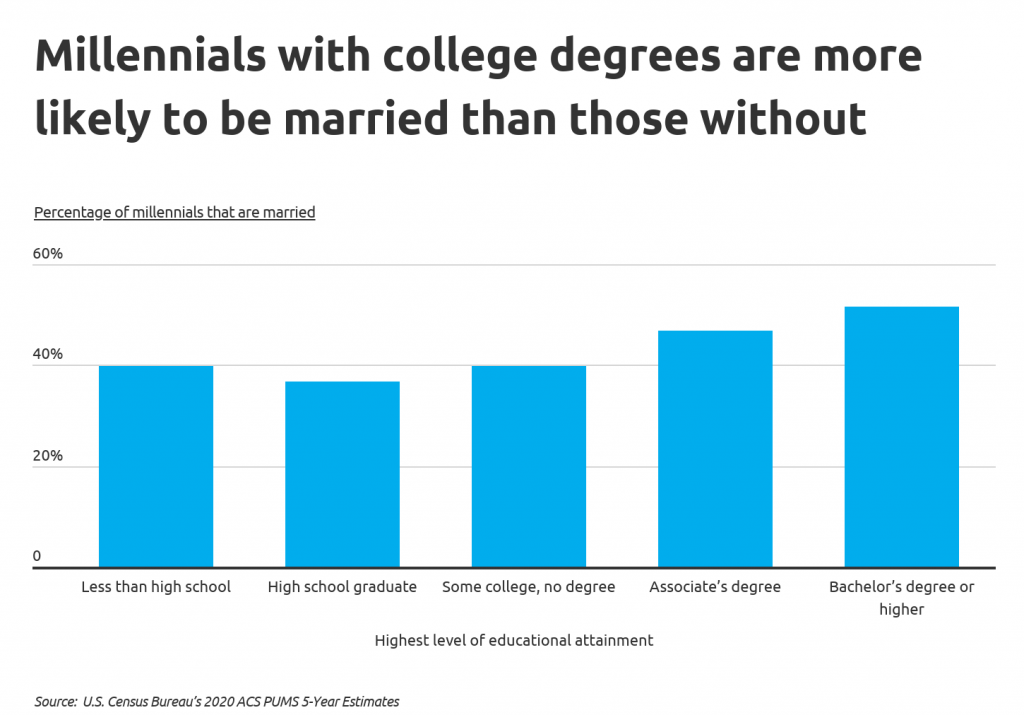
One reason for these shifts is an increasing prioritization of higher education. As educational attainment has grown in social and economic importance over time, young people are increasingly waiting until they have completed degrees to get married. And the most educated millennials are also the most likely to be married: 51.5% of millennials with a bachelor’s degree or higher and 46.9% with an associate’s degree are married, while those who haven’t completed a college degree are married less than 40% of the time.
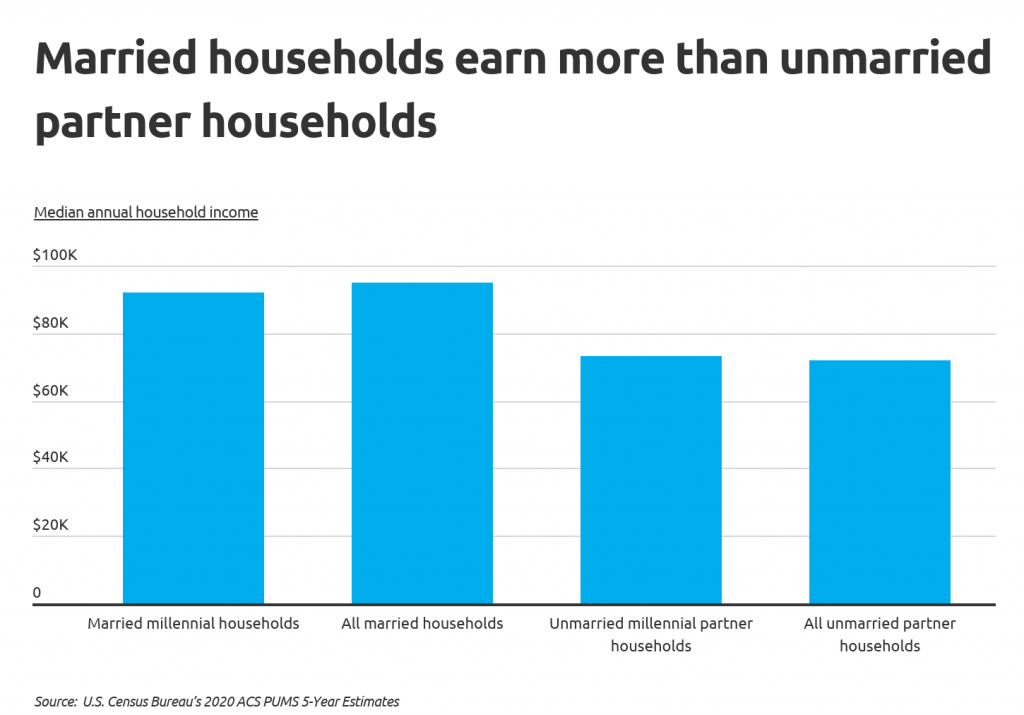
Educational attainment may also explain why married millennials tend to be better positioned economically than their unmarried peers. The median annual household income for married millennials is $92,000—just below the $95,000 median for all married households, and significantly higher than the $73,200 median in unmarried millennial partner households. Interestingly, however, unmarried millennials may fare better than unmarried members of other generations, as the median income for all unmarried households is $72,000.
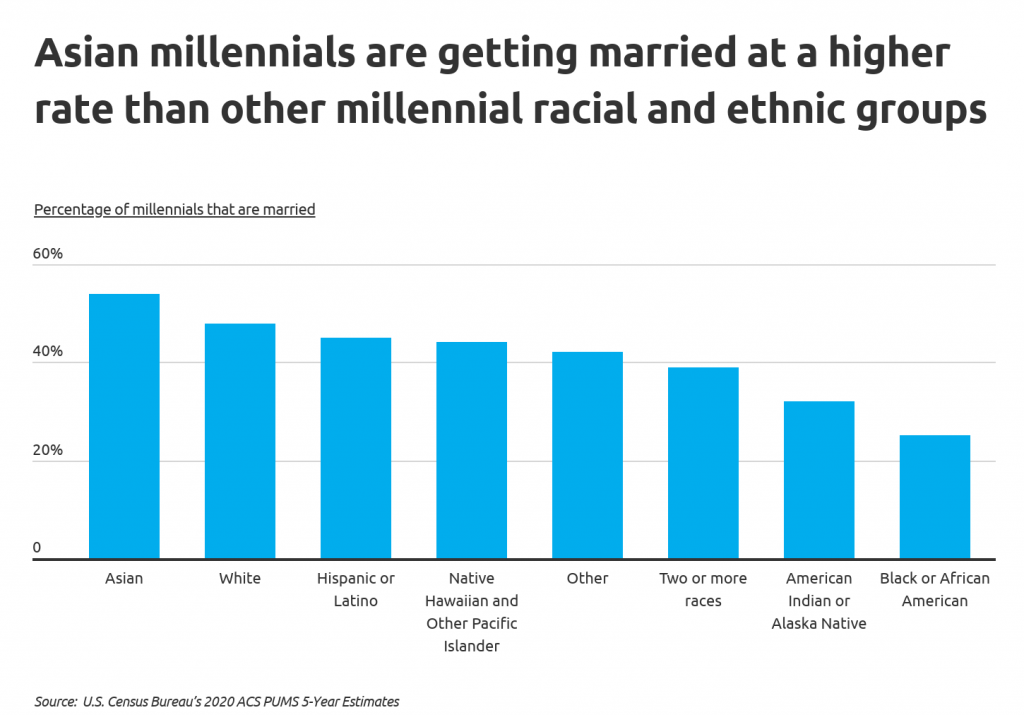
Millennial marriage trends also break down along racial lines. Asian and White millennials marry at the highest rates compared to all other racial and ethnic groups at 54.1% and 48.2%, respectively. On the other end of this spectrum, the marriage rate for Black millennials (24.7%) and American Indian or Alaska Native millennials (32.4%) are lowest among their peers.
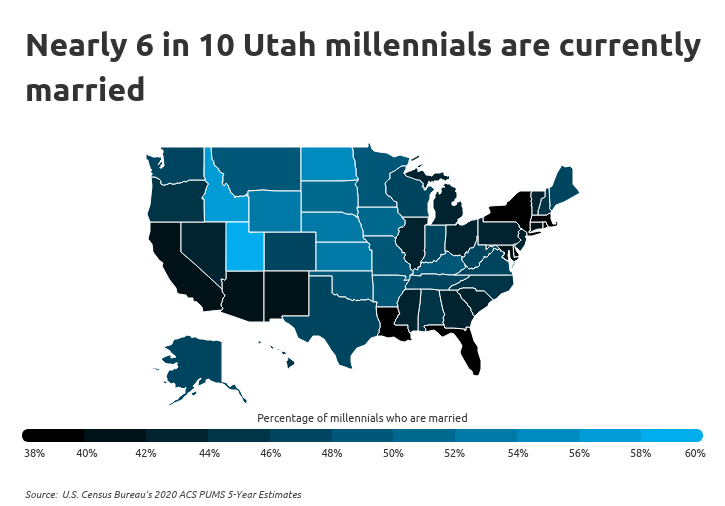
With a host of social and economic factors correlating to millennials’ marital status, marriage rates for the generation also vary by geography. Many of the states where young people are least likely to be married are expensive Northeastern states like New York or Massachusetts, or states with higher-than-average populations of racial and ethnic minorities, like Florida, Louisiana, and New Mexico.
The top state for millennial marriages is Utah, where 59.6% of millennials are married. This is likely due to the strong presence of Mormons in the state, who tend to marry more frequently than members of other religious groups. And Utah’s largest metro, Salt Lake City, leads the list of cities in the percentage of millennials who are married at 52.5%—just one of two major metros where more than half of millennials are married.
The data used in this analysis is from the U.S. Census Bureau. To determine the locations where millennials are getting married, researchers at Self Financial calculated the share of millennials who are married out of all millennials. In the event of a tie, the location with the higher percentage of millennial males who are married was ranked higher. To improve relevance, only metropolitan areas with at least 100,000 residents were included. Additionally, metros were grouped into cohorts based on population size: small (100,000–349,999), midsize (350,000–999,999), and large (1,000,000 or more). Note: only locations with complete data available were included.
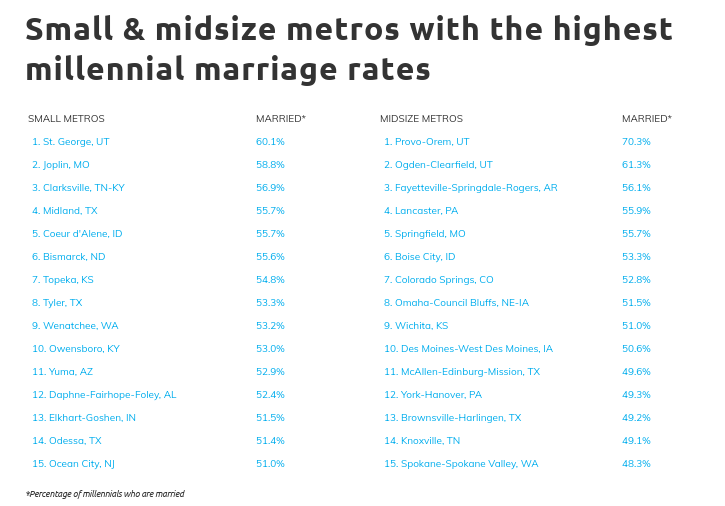
Here are the U.S. metros with the highest millennial marriage rates.
Large Metros With the Highest Millennial Marriage Rates

Photo Credit: Andriy Blokhin / Shutterstock
15. Sacramento-Roseville-Folsom, CA
- Percentage of millennials who are married: 45.4%
- Percentage of millennial males who are married: 41.9%
- Percentage of millennial females who are married: 48.8%
- Median length of current marriage among millennials (years): 8
- Median household income among married millennials: $97,000

Photo Credit: Rudy Balasko / Shutterstock
14. Cincinnati, OH-KY-IN
- Percentage of millennials who are married: 45.5%
- Percentage of millennial males who are married: 43.0%
- Percentage of millennial females who are married: 48.0%
- Median length of current marriage among millennials (years): 8
- Median household income among married millennials: $97,500
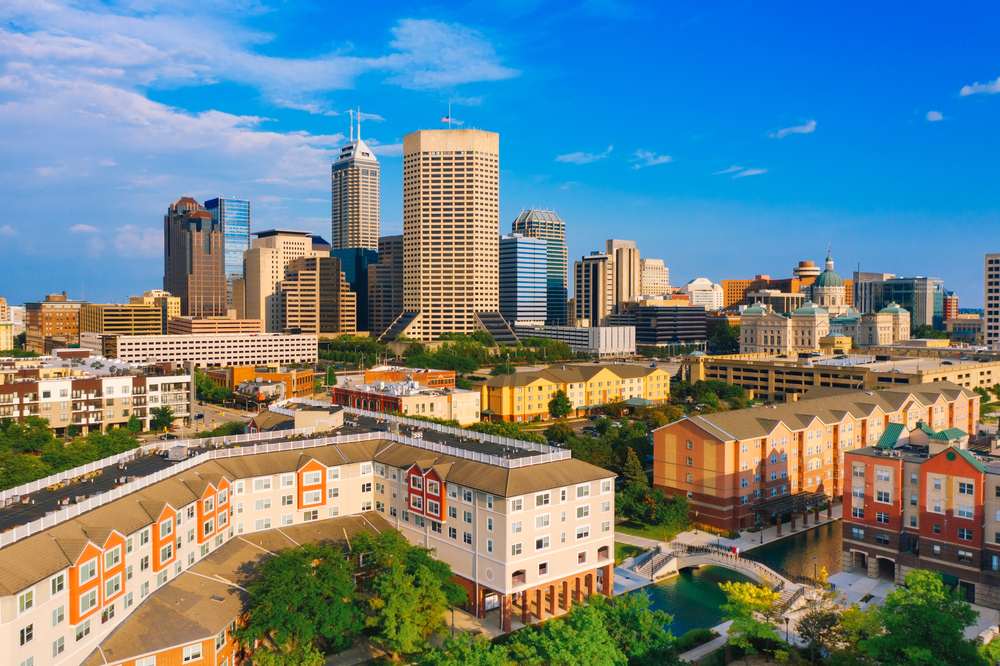
Photo Credit: Agnieszka Gaul / Shutterstock
13. Indianapolis-Carmel-Anderson, IN
- Percentage of millennials who are married: 46.5%
- Percentage of millennial males who are married: 44.7%
- Percentage of millennial females who are married: 48.3%
- Median length of current marriage among millennials (years): 8
- Median household income among married millennials: $93,000

Photo Credit: Dave Riewe / Shutterstock
12. Minneapolis-St. Paul-Bloomington, MN-WI
- Percentage of millennials who are married: 46.9%
- Percentage of millennial males who are married: 42.7%
- Percentage of millennial females who are married: 51.3%
- Median length of current marriage among millennials (years): 8
- Median household income among married millennials: $115,000

Photo Credit: Jeremy Janus / Shutterstock
11. Seattle-Tacoma-Bellevue, WA
- Percentage of millennials who are married: 47.0%
- Percentage of millennial males who are married: 42.8%
- Percentage of millennial females who are married: 51.5%
- Median length of current marriage among millennials (years): 8
- Median household income among married millennials: $126,000
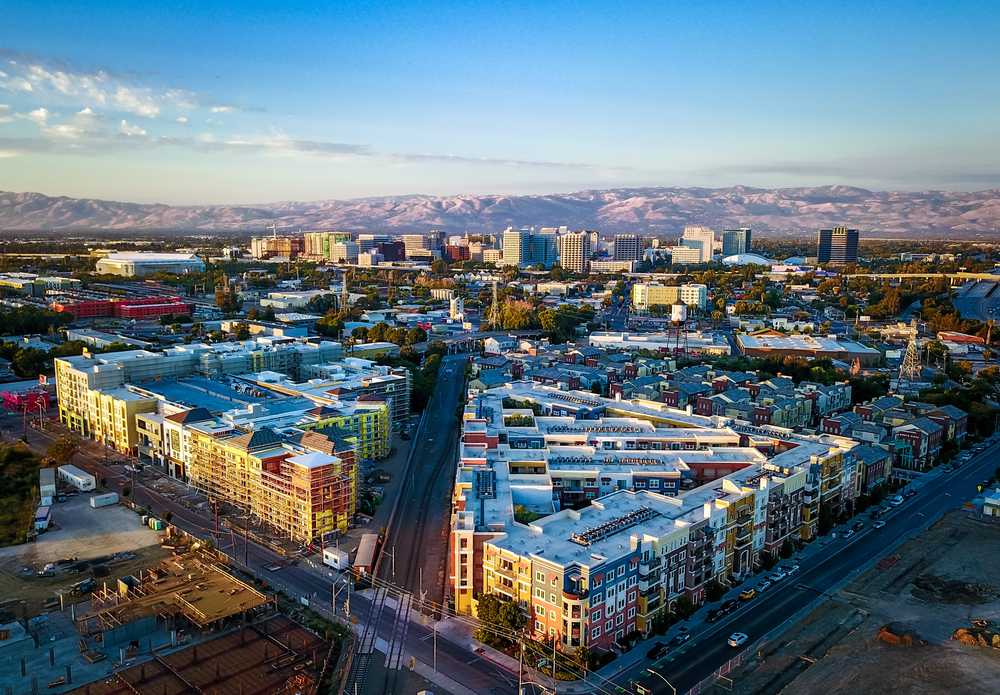
Photo Credit: Uladzik Kryhin / Shutterstock
10. San Jose-Sunnyvale-Santa Clara, CA
- Percentage of millennials who are married: 47.6%
- Percentage of millennial males who are married: 42.5%
- Percentage of millennial females who are married: 53.4%
- Median length of current marriage among millennials (years): 8
- Median household income among married millennials: $180,200

Photo Credit: f11photo / Shutterstock
9. Nashville-Davidson–Murfreesboro–Franklin, TN
- Percentage of millennials who are married: 47.9%
- Percentage of millennial males who are married: 46.0%
- Percentage of millennial females who are married: 49.7%
- Median length of current marriage among millennials (years): 8
- Median household income among married millennials: $93,000

Photo Credit: Sean Pavone / Shutterstock
8. Birmingham-Hoover, AL
- Percentage of millennials who are married: 48.0%
- Percentage of millennial males who are married: 46.5%
- Percentage of millennial females who are married: 49.5%
- Median length of current marriage among millennials (years): 8
- Median household income among married millennials: $86,000

Photo Credit: nektofadeev / Shutterstock
7. Houston-The Woodlands-Sugar Land, TX
- Percentage of millennials who are married: 48.1%
- Percentage of millennial males who are married: 45.3%
- Percentage of millennial females who are married: 50.9%
- Median length of current marriage among millennials (years): 8
- Median household income among married millennials: $96,400

Photo Credit: Natalia Bratslavsky / Shutterstock
6. Oklahoma City, OK
- Percentage of millennials who are married: 48.3%
- Percentage of millennial males who are married: 44.4%
- Percentage of millennial females who are married: 52.1%
- Median length of current marriage among millennials (years): 8
- Median household income among married millennials: $85,000
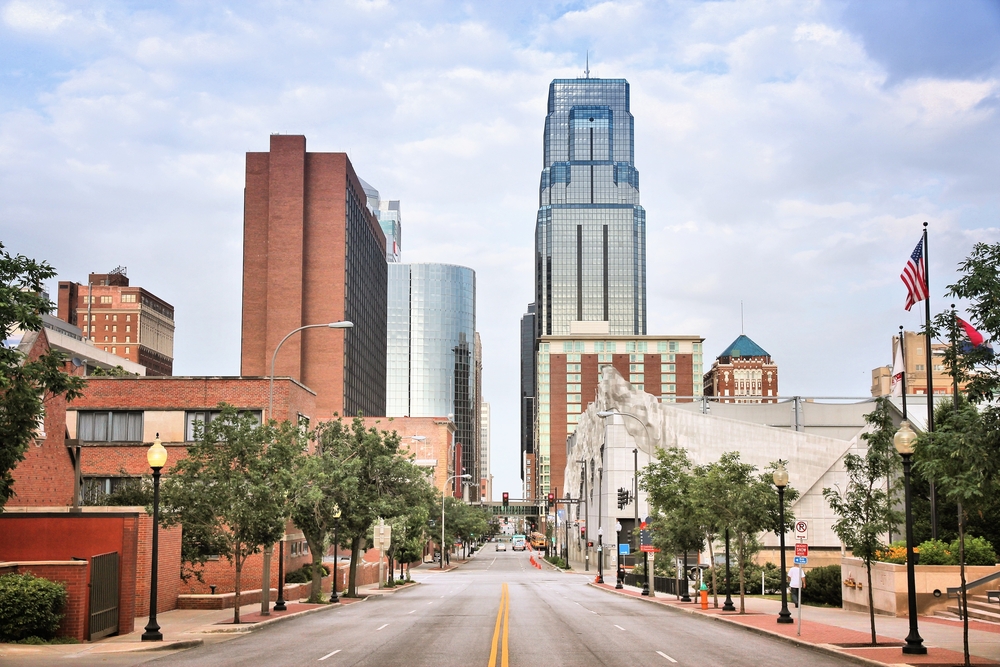
Photo Credit: Tupungato / Shutterstock
5. Kansas City, MO-KS
- Percentage of millennials who are married: 48.3%
- Percentage of millennial males who are married: 45.7%
- Percentage of millennial females who are married: 50.9%
- Median length of current marriage among millennials (years): 8
- Median household income among married millennials: $96,500

Photo Credit: Farid Sani / Shutterstock
4. Raleigh, NC
- Percentage of millennials who are married: 48.5%
- Percentage of millennial males who are married: 46.1%
- Percentage of millennial females who are married: 50.8%
- Median length of current marriage among millennials (years): 8
- Median household income among married millennials: $104,000

Photo Credit: CK Foto / Shutterstock
3. Dallas-Fort Worth-Arlington, TX
- Percentage of millennials who are married: 49.0%
- Percentage of millennial males who are married: 46.5%
- Percentage of millennial females who are married: 51.4%
- Median length of current marriage among millennials (years): 8
- Median household income among married millennials: $95,000

Photo Credit: Photosbykaity / Shutterstock
2. Grand Rapids-Kentwood, MI
- Percentage of millennials who are married: 50.2%
- Percentage of millennial males who are married: 47.2%
- Percentage of millennial females who are married: 53.3%
- Median length of current marriage among millennials (years): 8
- Median household income among married millennials: $90,000

Photo Credit: photo.ua / Shutterstock
1. Salt Lake City, UT
- Percentage of millennials who are married: 52.5%
- Percentage of millennial males who are married: 49.1%
- Percentage of millennial females who are married: 56.1%
- Median length of current marriage among millennials (years): 9
- Median household income among married millennials: $90,000
Detailed Findings & Methodology
The data used in this analysis is from the U.S. Census Bureau’s 2020 ACS PUMS 5-Year Estimates. To determine the locations where millennials are getting married, researchers calculated the share of millennials who are married out of all millennials. In the event of a tie, the location with the higher percentage of millennial males who are married was ranked higher. To improve relevance, only metropolitan areas with at least 100,000 residents were included. Additionally, metros were grouped into cohorts based on population size: small (100,000–349,999), midsize (350,000–999,999), and large (1,000,000 or more). Note: only locations with complete data available were included.