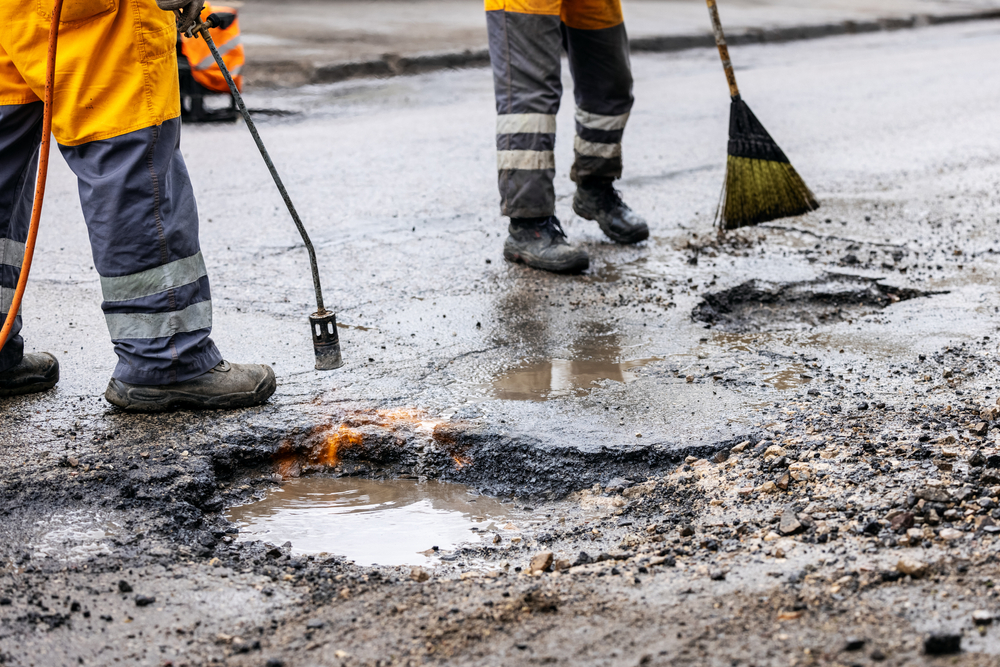
Photo Credit: ronstik / Shutterstock
Roadways are a vital component of infrastructure in the United States. The vast majority of goods are transported by truck, highlighting the economy’s need for reliable roadways to connect supply chains and move goods and services efficiently across borders. Most commuters use roads daily to get to work, and individuals also rely on roadways for crucial access to resources including employment, social, health, and education services.
However, many highways, major roads, and bridges are in need of repair. Hazardous road conditions can negatively impact the economy, contribute to traffic congestion, and impact the safety of Americans. The passing of the Infrastructure Investment and Jobs Act (also referred to as the Bipartisan Infrastructure Package) highlights the importance of reliable roads in the U.S., and the commitment to improving America’s infrastructure. The 2021 bill signed by President Joe Biden dedicated $110 billion in funding to repair and update roads and bridges, in addition to supporting major transformational roadway projects across the U.S.
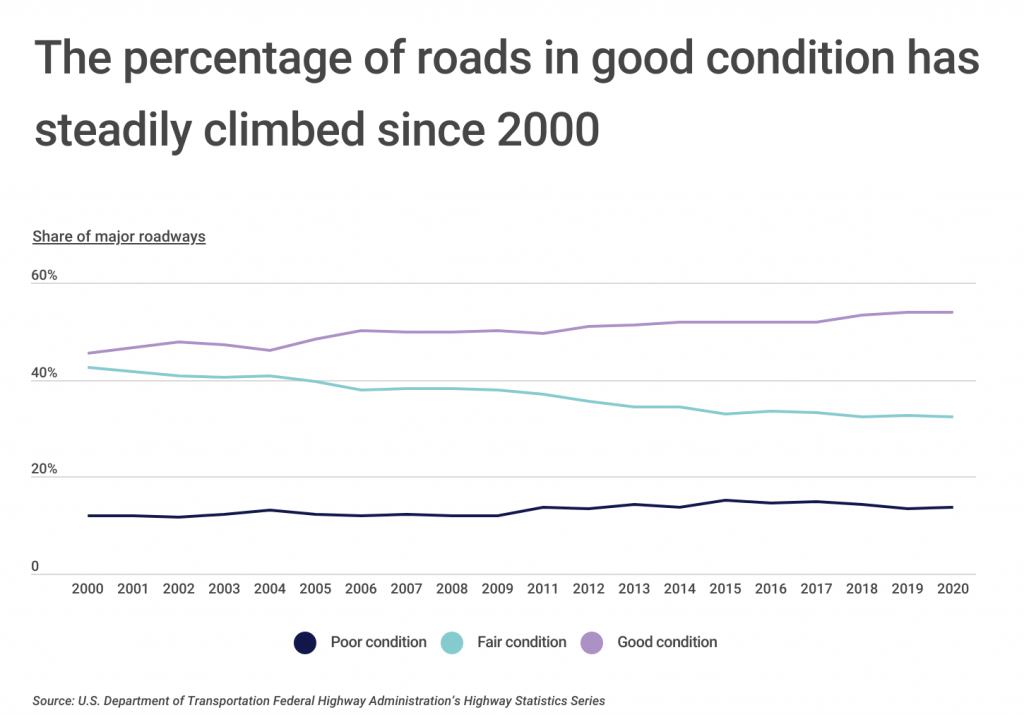
Despite this massive investment, America still has its fair share of hazardous roads. From 2000 to 2020, the share of major roadways in poor condition has remained fairly steady, rising from 11.8% to 13.8% over the course of 20 years. While frustrating for vehicle owners and operators, there’s more promising news: the share of roads in good condition has steadily increased since 2000, rising a total of 8.4 percentage points, from 45.5% in 2000 to 53.9% in 2020.
The share of major roadways in fair condition, or the category between good and poor, was the only category to shrink over the last 20 years, falling from 42.6% in 2000 to 32.3% in 2020—a decrease of over 10 percentage points.
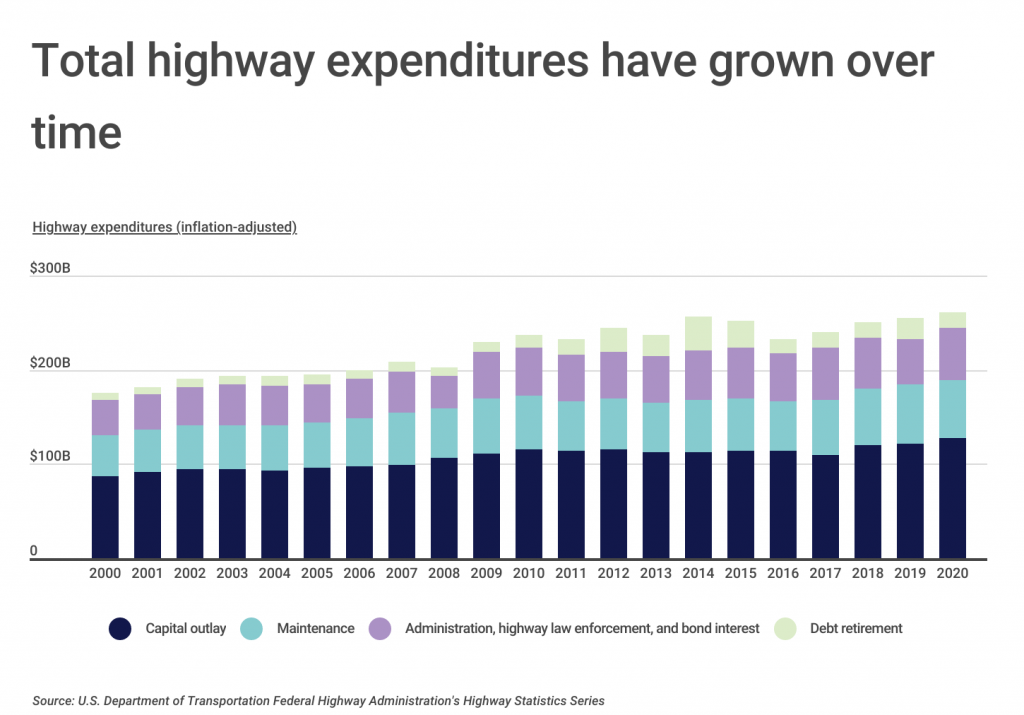
There’s no shortage of roads that need fixing, and total highway expenditures have grown over the past 20 years, highlighting the government’s commitment to improving America’s most common form of transportation. Funds dedicated to capital outlay, or the cost of equipment or expenditures to make improvements including construction, grew the most and secured the most funds, increasing from $87.4 billion in 2000 to $127.7 billion in 2020. Spending on maintenance also increased by nearly $20 billion, climbing from $43.7 billion in 2000 to $61.4 billion in 2020.
Highway costs aren’t isolated to physical improvements. Expenditures in administration, highway law enforcement, and bond interest have also increased in order to maintain orderly and safe roadways. This particular area of spending grew from $36.6 billion in 2000 to $55.1 billion in 2020.
While roads serve as important infrastructure, and investments in roadway improvements are growing, there are still regions where road quality is lagging behind. A surprising amount of East Coast states—where individuals are more likely to commute via public transit—are home to a large share of roadways in poor condition, while Midwest states are more likely to be farther down the list.
The data used in this analysis is from the U.S. Department of Transportation Federal Highway Administration. To determine the states with the worst roads, researchers at Construction Coverage calculated the share of major roadways in poor condition. In the event of a tie, the state with the lower percentage of roadways in good condition was ranked higher. Major roadways are defined to include interstates, other freeways and expressways, other principal arterials, and minor arterials.
Here are the states with the worst roads.
U.S. States With the Worst Roads
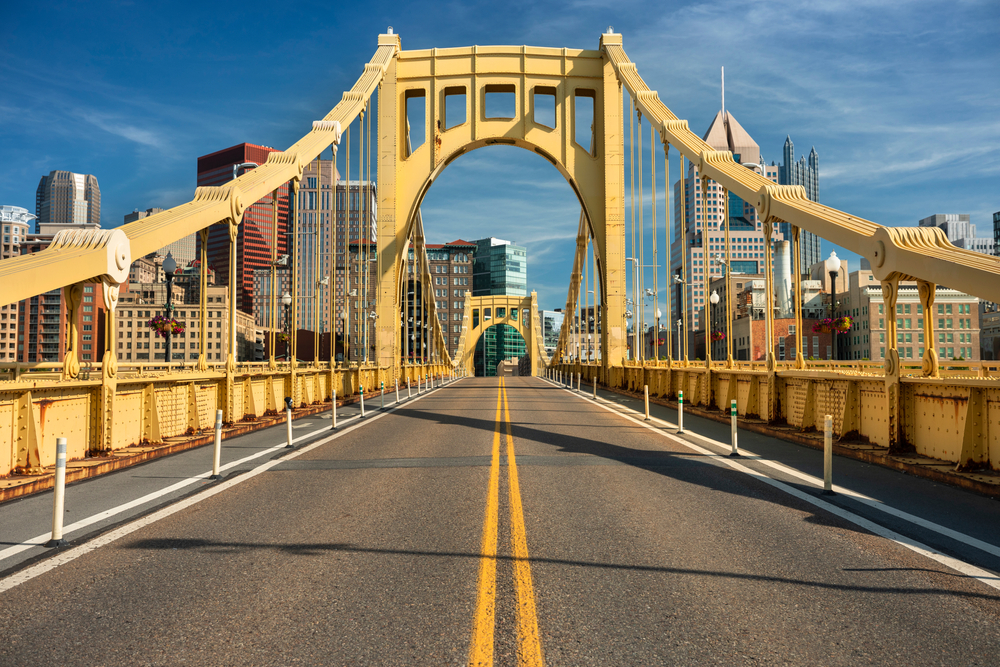
Photo Credit: AevanStock / Shutterstock
15. Pennsylvania
- Share of major roadways in poor condition: 16.8%
- Share of major roadways in fair condition: 39.9%
- Share of major roadways in good condition: 43.3%
- Daily vehicle-miles traveled per capita: 18.8

Photo Credit: Nicholas Courtney / Shutterstock
14. Colorado
- Share of major roadways in poor condition: 17.5%
- Share of major roadways in fair condition: 41.0%
- Share of major roadways in good condition: 41.5%
- Daily vehicle-miles traveled per capita: 23.4

Photo Credit: Felix Mizioznikov / Shutterstock
13. Louisiana
- Share of major roadways in poor condition: 17.6%
- Share of major roadways in fair condition: 41.9%
- Share of major roadways in good condition: 40.4%
- Daily vehicle-miles traveled per capita: 28.4
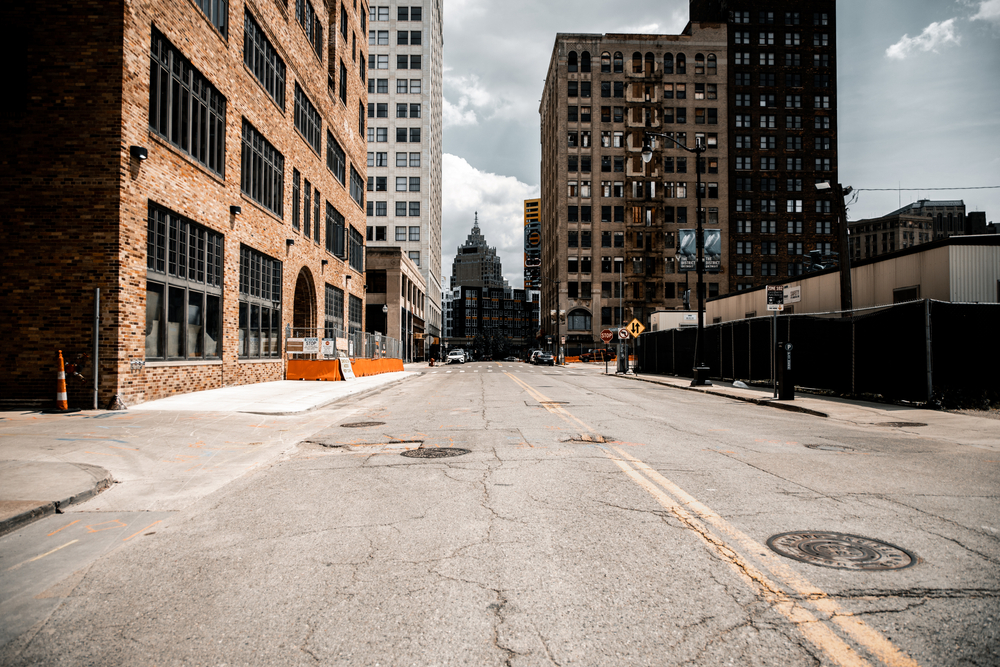
Photo Credit: Mrbrown928 / Shutterstock
12. Michigan
- Share of major roadways in poor condition: 18.4%
- Share of major roadways in fair condition: 30.6%
- Share of major roadways in good condition: 51.0%
- Daily vehicle-miles traveled per capita: 23.8
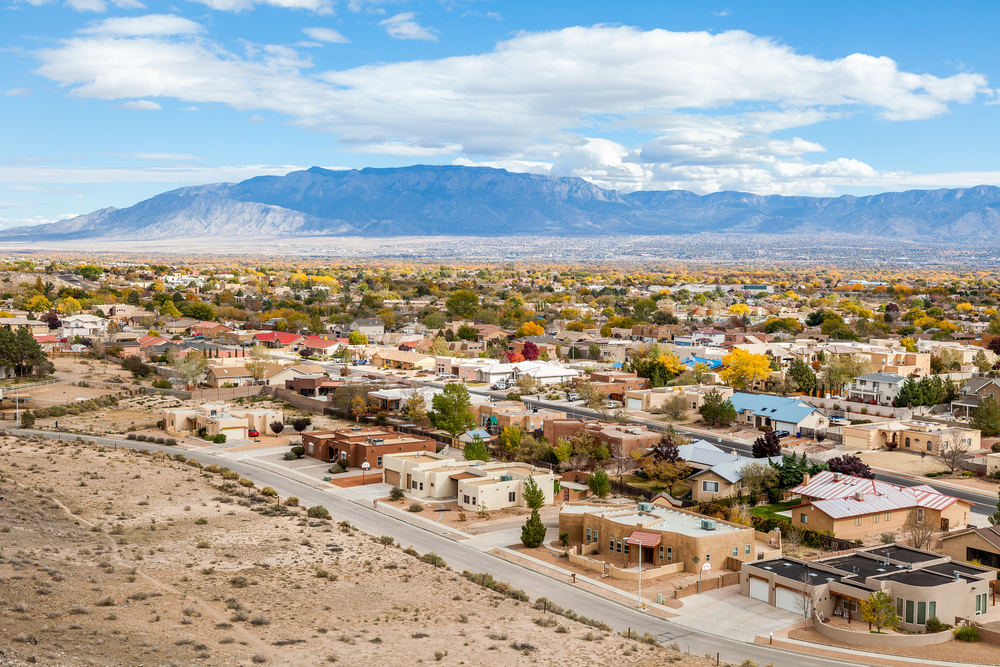
Photo Credit: turtix / Shutterstock
11. New Mexico
- Share of major roadways in poor condition: 19.6%
- Share of major roadways in fair condition: 30.6%
- Share of major roadways in good condition: 49.9%
- Daily vehicle-miles traveled per capita: 31.0

Photo Credit: Brandon Mauth / Shutterstock
10. Washington
- Share of major roadways in poor condition: 19.6%
- Share of major roadways in fair condition: 40.6%
- Share of major roadways in good condition: 39.8%
- Daily vehicle-miles traveled per capita: 19.6

Photo Credit: ESB Professional / Shutterstock
9. Maryland
- Share of major roadways in poor condition: 20.5%
- Share of major roadways in fair condition: 29.1%
- Share of major roadways in good condition: 50.4%
- Daily vehicle-miles traveled per capita: 23.1

Photo Credit: Sean Pavone / Shutterstock
8. Wisconsin
- Share of major roadways in poor condition: 22.1%
- Share of major roadways in fair condition: 37.6%
- Share of major roadways in good condition: 40.2%
- Daily vehicle-miles traveled per capita: 27.2

Photo Credit: RodClementPhotography / Shutterstock
7. Connecticut
- Share of major roadways in poor condition: 23.7%
- Share of major roadways in fair condition: 43.3%
- Share of major roadways in good condition: 33.1%
- Daily vehicle-miles traveled per capita: 22.9

Photo Credit: William Perugini / Shutterstock
6. New York
- Share of major roadways in poor condition: 24.0%
- Share of major roadways in fair condition: 36.7%
- Share of major roadways in good condition: 39.3%
- Daily vehicle-miles traveled per capita: 14.4

Photo Credit: Fen Kuntz / Shutterstock
5. Hawaii
- Share of major roadways in poor condition: 26.1%
- Share of major roadways in fair condition: 44.7%
- Share of major roadways in good condition: 29.0%
- Daily vehicle-miles traveled per capita: 16.9

Photo Credit: Sean Pavone / Shutterstock
4. Massachusetts
- Share of major roadways in poor condition: 29.5%
- Share of major roadways in fair condition: 35.9%
- Share of major roadways in good condition: 34.6%
- Daily vehicle-miles traveled per capita: 21.6
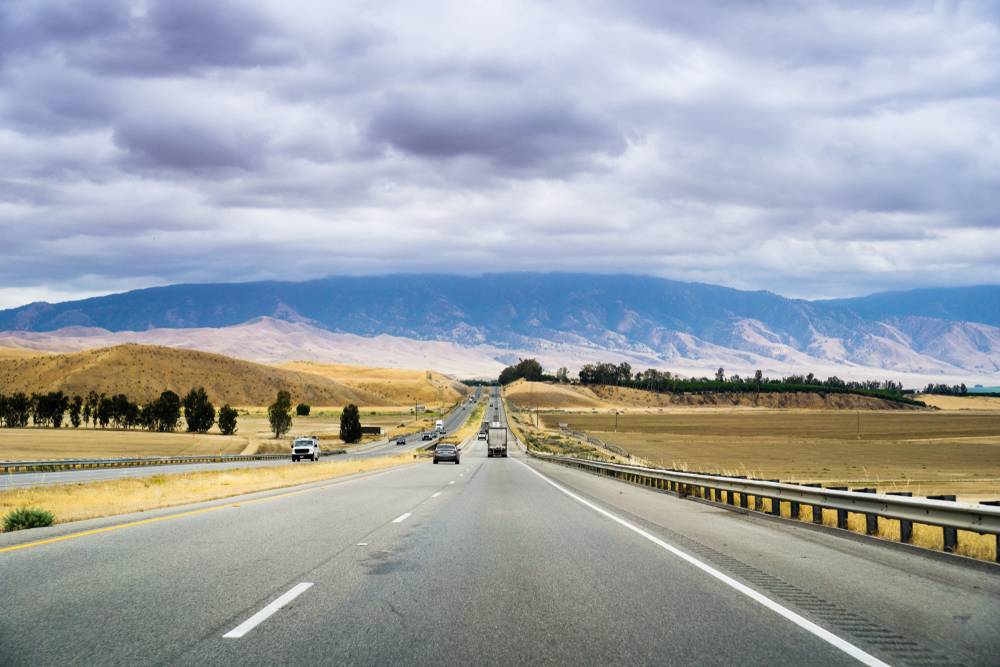
Photo Credit: Sundry Photography / Shutterstock
3. California
- Share of major roadways in poor condition: 30.8%
- Share of major roadways in fair condition: 32.9%
- Share of major roadways in good condition: 36.3%
- Daily vehicle-miles traveled per capita: 20.9
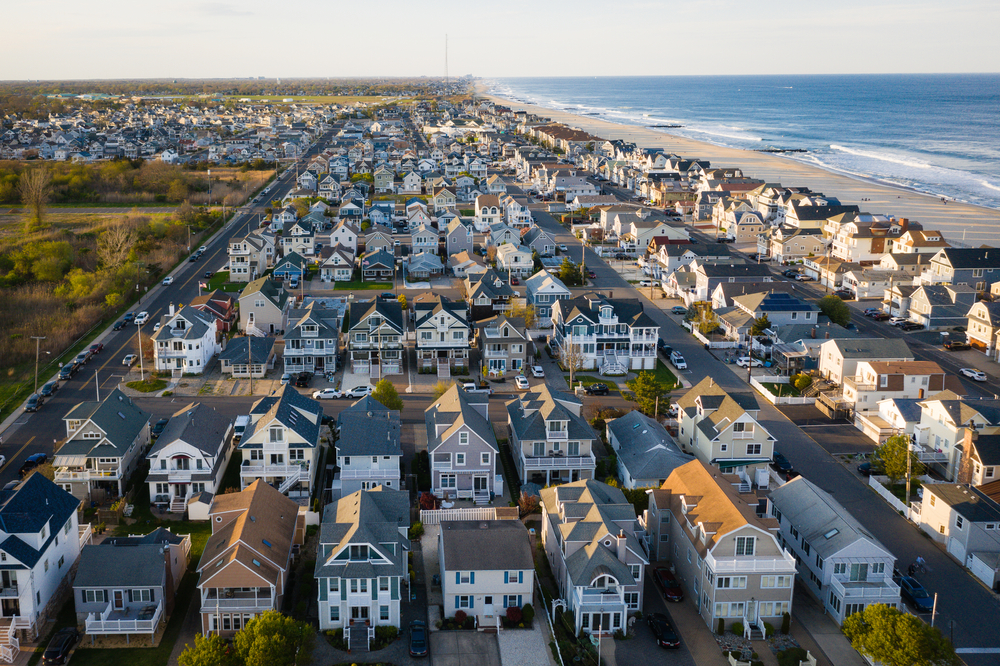
Photo Credit: FotosForTheFuture / Shutterstock
2. New Jersey
- Share of major roadways in poor condition: 36.4%
- Share of major roadways in fair condition: 31.1%
- Share of major roadways in good condition: 32.5%
- Daily vehicle-miles traveled per capita: 20.5

Photo Credit: ESB Professional / Shutterstock
1. Rhode Island
- Share of major roadways in poor condition: 38.8%
- Share of major roadways in fair condition: 37.1%
- Share of major roadways in good condition: 24.0%
- Daily vehicle-miles traveled per capita: 17.8
Detailed Findings & Methodology
The data used in this analysis is from the U.S. Department of Transportation Federal Highway Administration’s Highway Statistics Series. To determine the states with the worst roads, researchers at Construction Coverage calculated the percentage of major roadways in poor condition using the latest data available. In the event of a tie, the state with the lower share of major roadways in good condition was ranked higher. Major roadways are defined to include interstates, other freeways and expressways, other principal arterials, and minor arterials. The International Roughness Index (IRI) was used to classify poor, fair, and good conditions of roadways by the following criteria:
- Poor: IRI greater than 170 inches/mile
- Fair: IRI between 95 and 170 inches/mile
- Good: IRI less than 95 inches/mile