Photo Credit: Jessica Kirsh / Shutterstock
Despite home prices starting to stabilize, becoming a homeowner remains largely out of reach for many Americans. According to The Cato Institute’s 2022 Housing Affordability National Survey, 87% of Americans are concerned about the cost of housing. In the same survey, 55% of homeowners say they couldn’t afford to purchase their own home today based on current prices, and 69% worry that their children or grandchildren won’t be able to afford a home in the future.
Multiple factors have contributed to the difficulty of owning a home. According to the National Association of Realtors, decades of underinvestment in residential construction has created a national shortage of at least 5.5 million homes. But more recently, increased demand combined with record low mortgage rates during the COVID-19 pandemic caused a surge in home-buying, further reducing the inventory of available homes on the market. In fact, the number of active listings in the U.S. dropped by more than 60% between February 2020 and February 2022, falling from over 900,000 listings down to under 350,000. Additionally, the cost of construction materials has skyrocketed since the pandemic began in 2020, primarily due to material shortages and widespread inflation.
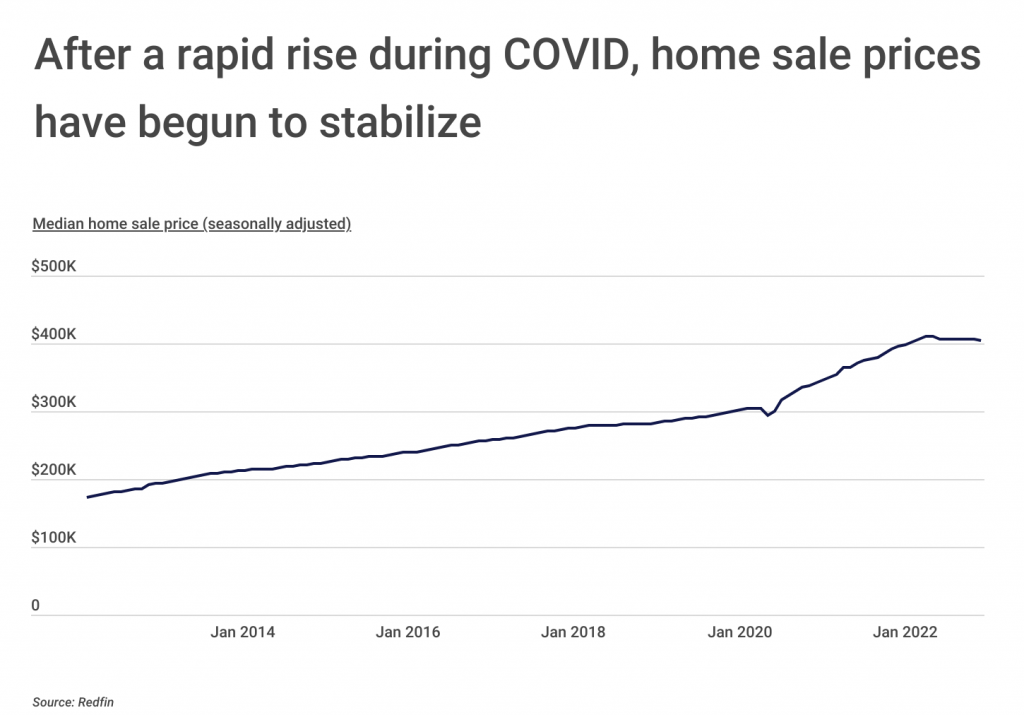
After a tumultuous rise in home prices during the COVID-19 pandemic, today’s housing market has finally started showing signs of cooling off. From February 2020 to April 2022, the median home sale price increased from $304,000 to a peak of $410,000. That means in just over two years, the median home sale price increased nearly 35%. For perspective, it took nearly five years prior to that point to see a similar percentage gain in median home sale prices.
This rapid rise is reversing, just much more slowly: from April 2022 to December 2022, the median home sale price stayed relatively flat, declining from $410,000 to $405,000. While a deceleration in home sale price growth is certainly relieving to those looking to buy, home prices are still roughly 33% more expensive than they were pre-pandemic. And unless home listings experience an extreme price correction, climbing interest rates may continue to keep home prices out of reach for many. As of February 2023, the federal funds effective rate was 4.58%, the highest it’s been since prior to the Great Recession.
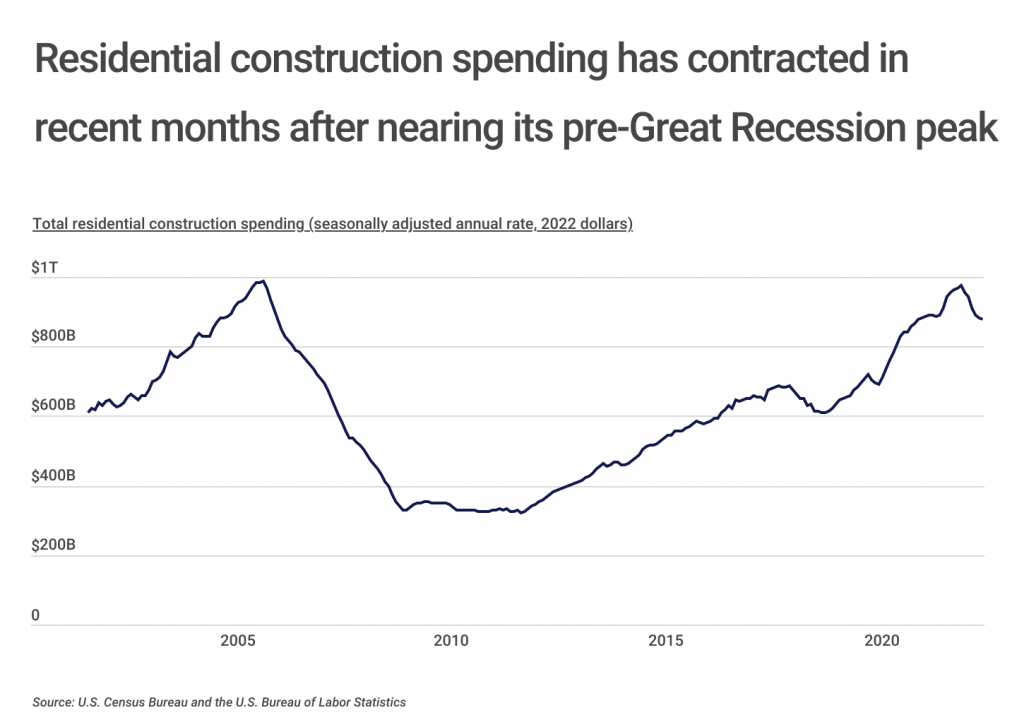
Further, despite a federal government initiative aimed at increasing the number of homes available, there’s been a reduction in residential construction spending over the last few months that’s poised to make the problem of limited housing inventory even worse. The seasonally-adjusted annual rate of residential construction spending increased by $641 billion from April 2012 to May 2022, after adjusting for inflation and seasonality, but that number is currently trending down. Between May 2022 and November 2022, annual spending decreased by $97 billion, which means less money is currently being allocated towards new housing inventory.
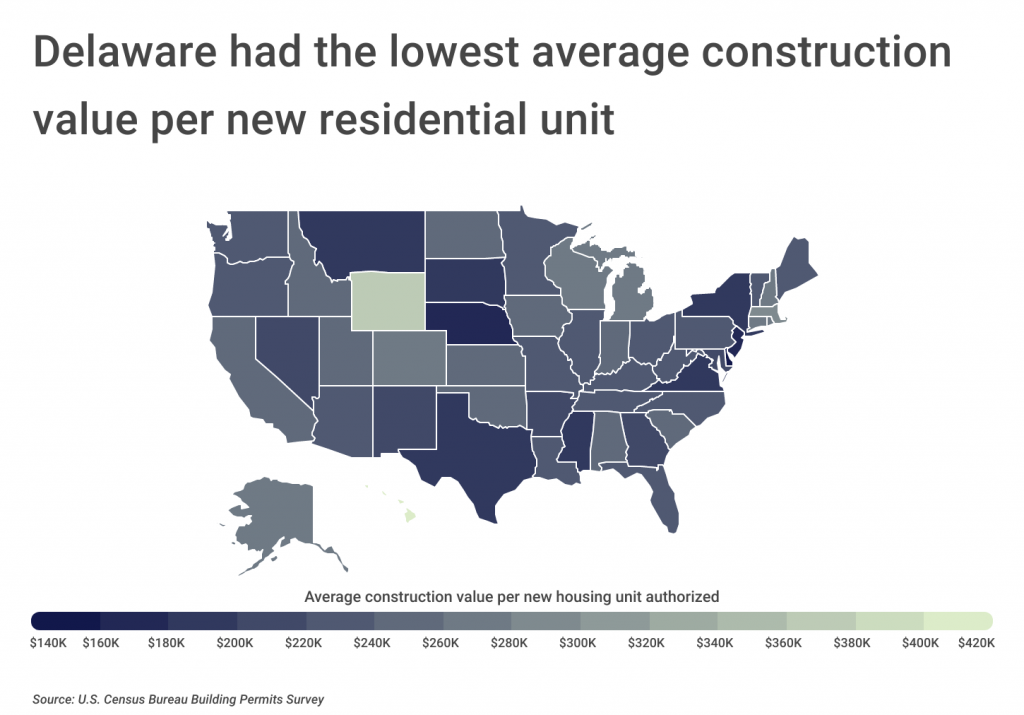
While less money is being funneled into building new homes nationwide, some states and cities are able to do more with less, constructing more affordable housing units compared to others. At the state level, Delaware has the lowest average construction cost per new residential unit authorized, with an average value of $142,259. New Jersey and Nebraska are not far behind, with average values of $162,573 and $167,257 per unit, respectively. These figures are an estimation of the physical structure value and do not include the land value.
These construction costs are particularly in focus now with home prices at record highs and residential construction spending waning. Demand for single-family homes surged during COVID, and homebuilders began prioritizing building those homes over multi-family units. Today, however, some areas are focusing on multi-family housing, which typically has lower construction costs per unit and can help to alleviate housing inventory issues.
The data used in this analysis is from the U.S. Census Bureau and Zillow. Researchers at Construction Coverage ranked locations by average construction value per new housing unit authorized in 2022. In the event of a tie, the location with the higher total new housing units authorized in 2022 was ranked higher.
Here are the U.S. metropolitan areas investing in more affordable housing.
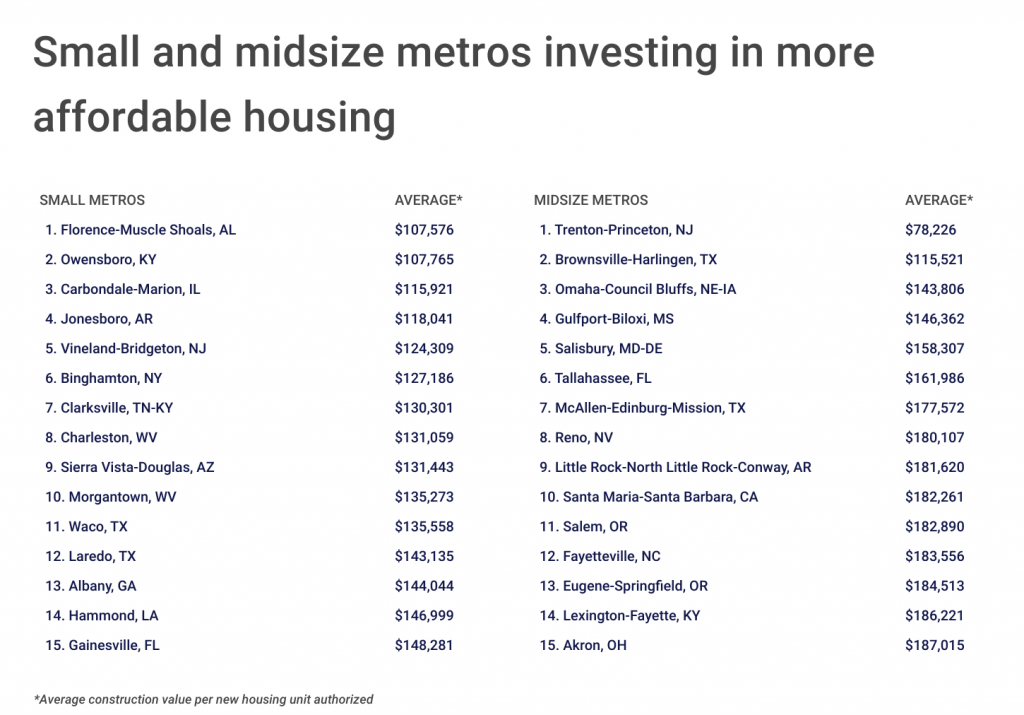
Large Metros Investing in More Affordable Housing

Photo Credit: f11photo / Shutterstock
15. Salt Lake City, UT
- Average construction value per new housing unit authorized: $207,274
- Total new housing units authorized: 9,913
- Total construction value of new housing units authorized: $2,054,710,000
- Median home price: $577,249
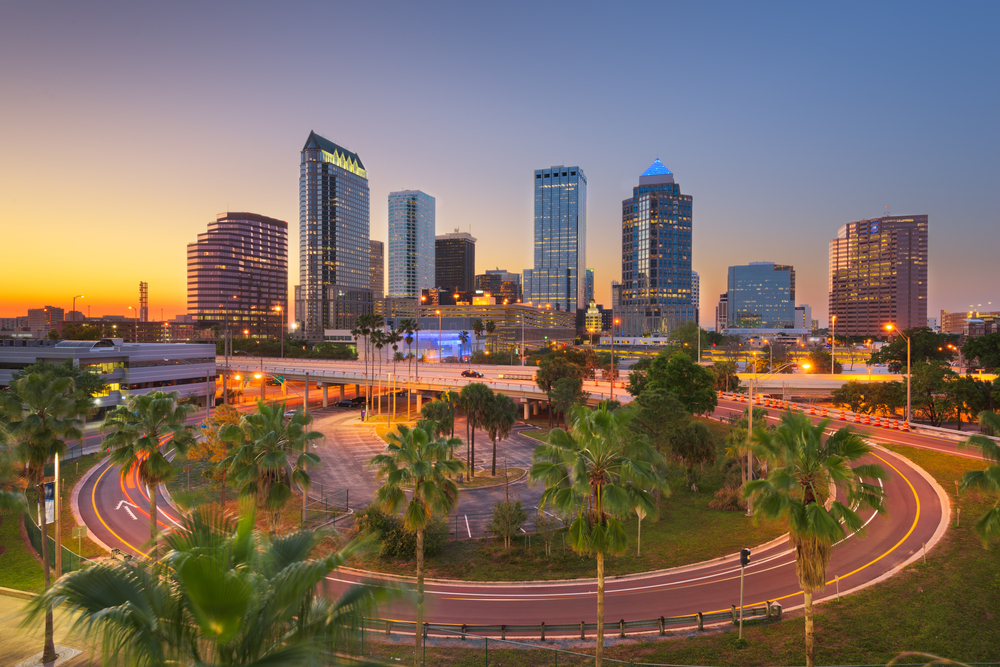
Photo Credit: Sean Pavone / Shutterstock
14. Tampa-St. Petersburg-Clearwater, FL
- Average construction value per new housing unit authorized: $207,184
- Total new housing units authorized: 29,960
- Total construction value of new housing units authorized: $6,207,244,000
- Median home price: $388,223
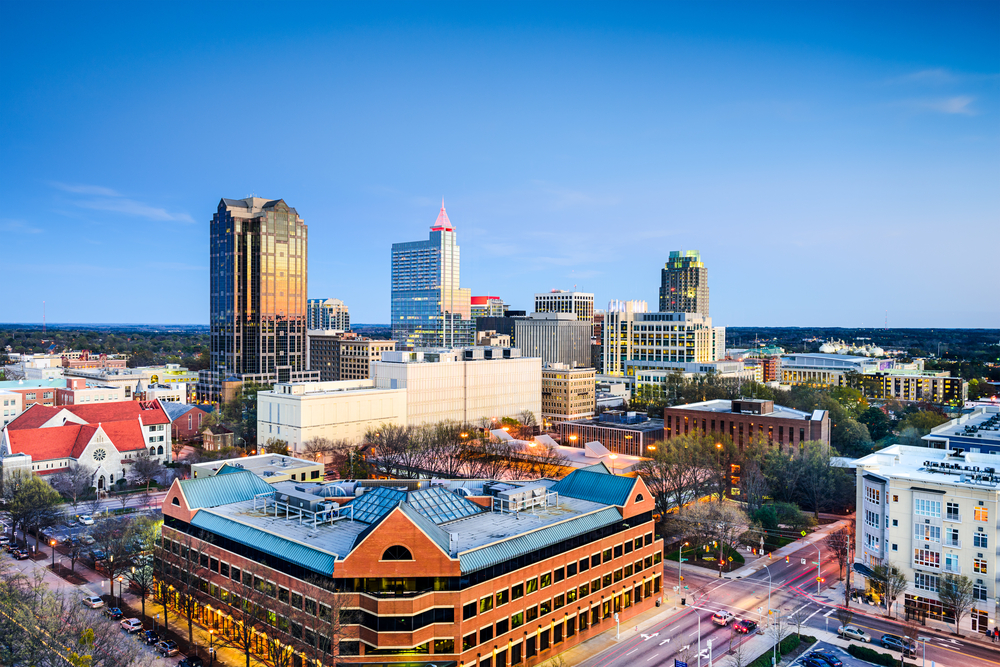
Photo Credit: ESB Professional / Shutterstock
13. Raleigh-Cary, NC
- Average construction value per new housing unit authorized: $205,196
- Total new housing units authorized: 21,551
- Total construction value of new housing units authorized: $4,422,185,000
- Median home price: $438,777

Photo Credit: Sean Pavone / Shutterstock
12. Atlanta-Sandy Springs-Alpharetta, GA
- Average construction value per new housing unit authorized: $202,431
- Total new housing units authorized: 47,157
- Total construction value of new housing units authorized: $9,546,045,000
- Median home price: $381,245
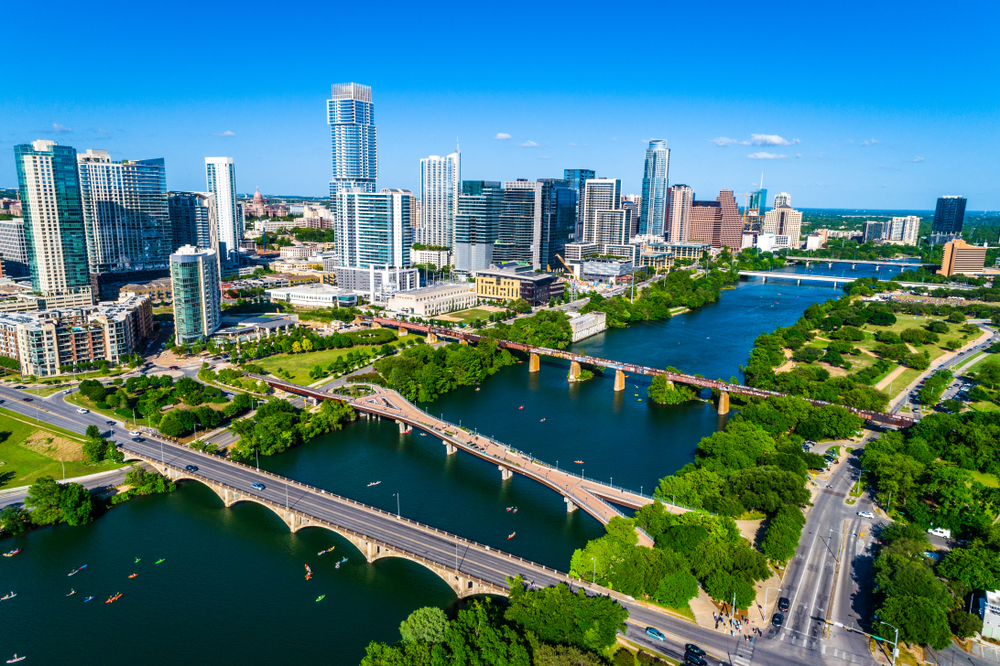
Photo Credit: Roschetzky Photography / Shutterstock
11. Austin-Round Rock-Georgetown, TX
- Average construction value per new housing unit authorized: $202,164
- Total new housing units authorized: 42,942
- Total construction value of new housing units authorized: $8,681,344,000
- Median home price: $537,243

Photo Credit: Sean Pavone / Shutterstock
10. Jacksonville, FL
- Average construction value per new housing unit authorized: $200,758
- Total new housing units authorized: 23,131
- Total construction value of new housing units authorized: $4,643,733,000
- Median home price: $374,931

Photo Credit: nektofadeev / Shutterstock
9. Houston-The Woodlands-Sugar Land, TX
- Average construction value per new housing unit authorized: $198,074
- Total new housing units authorized: 75,786
- Total construction value of new housing units authorized: $15,011,252,000
- Median home price: $312,952

Photo Credit: Jon Bilous / Shutterstock
8. Virginia Beach-Norfolk-Newport News, VA-NC
- Average construction value per new housing unit authorized: $196,077
- Total new housing units authorized: 6,273
- Total construction value of new housing units authorized: $1,229,993,000
- Median home price: $335,668

Photo Credit: Sean Pavone / Shutterstock
7. Baltimore-Columbia-Towson, MD
- Average construction value per new housing unit authorized: $190,659
- Total new housing units authorized: 6,596
- Total construction value of new housing units authorized: $1,257,590,000
- Median home price: $378,790

Photo Credit: f11photo / Shutterstock
6. Washington-Arlington-Alexandria, DC-VA-MD-WV
- Average construction value per new housing unit authorized: $185,244
- Total new housing units authorized: 32,296
- Total construction value of new housing units authorized: $5,982,630,000
- Median home price: $551,220

Photo Credit: Sean Pavone / Shutterstock
5. Hartford-East Hartford-Middletown, CT
- Average construction value per new housing unit authorized: $179,090
- Total new housing units authorized: 1,520
- Total construction value of new housing units authorized: $272,217,000
- Median home price: $323,983

Photo Credit: f11photo / Shutterstock
4. San Antonio-New Braunfels, TX
- Average construction value per new housing unit authorized: $174,560
- Total new housing units authorized: 24,006
- Total construction value of new housing units authorized: $4,190,491,000
- Median home price: $339,009

Photo Credit: Sean Pavone / Shutterstock
3. Richmond, VA
- Average construction value per new housing unit authorized: $173,424
- Total new housing units authorized: 10,407
- Total construction value of new housing units authorized: $1,804,826,000
- Median home price: $346,118

Photo Credit: Sean Pavone / Shutterstock
2. Philadelphia-Camden-Wilmington, PA-NJ-DE-MD
- Average construction value per new housing unit authorized: $172,772
- Total new housing units authorized: 13,902
- Total construction value of new housing units authorized: $2,401,880,000
- Median home price: $343,096

Photo Credit: dibrova / Shutterstock
1. New York-Newark-Jersey City, NY-NJ-PA
- Average construction value per new housing unit authorized: $168,124
- Total new housing units authorized: 58,991
- Total construction value of new housing units authorized: $9,917,783,000
- Median home price: $617,849
Detailed Findings & Methodology
The data used in this analysis is from the U.S. Census Bureau’s Building Permits Survey and Zillow’s Housing Data (ZHVI), a measure of typical home value. Researchers at Construction Coverage ranked locations by average construction value per new housing unit authorized in 2022. Housing unit valuation is an estimate of the structure value and not a reflection of the land value. In the event of a tie, the location with the higher total new housing units authorized in 2022 was ranked higher. To improve relevance, only metropolitan areas with at least 100,000 residents were included and metros were grouped into cohorts based on population size: small (100,000–349,999), midsize (350,000–999,999), and large (1,000,000 or more).