Photo Credit: Jonathan Siegel / Shutterstock
The COVID-19 pandemic was a massive blow to the U.S.’s public transit systems. As businesses shuttered their doors and workers stopped commuting into the office, public transit ridership dropped to as low as 10% of pre-pandemic levels in many places. In response, Congress passed multiple bills that provided emergency funding to help keep public transit systems solvent. Now that the national emergency is coming to an end and many companies are requiring their employees to return to the office in varying capacities, public transportation is rebounding. When choosing where to live, commutability and access to public transportation may be important factors to consider.
Transit agencies received significant federal financial support to counter the effects of the COVID-19 pandemic on public transportation. Prior to the pandemic, in 2019, federal public transit funding amounted to $12.6 billion after adjusting for inflation. This amount nearly doubled in 2020 to $23.9 billion and then ballooned again to $28.3 billion in 2021.
At the same time, all other sources of public transit funding declined during the pandemic. From 2019 to 2021, state and local inflation-adjusted funding declined 9.2% and 25.0%, respectively. But other transit funding—which includes revenue sources like fares, advertising, and concessions—plummeted as more people opted to avoid public transportation. Revenue from these sources declined 56.6% during that same time period.
Due to the rapid shift to working from home caused by the pandemic, commuters patronized public transportation less frequently over the last few years. Between 2010 and 2019, the share of workers who commuted using public transportation hovered at around 5%. By 2021, this had fallen to 2.5%, while the share of workers who worked from home tripled from less than 6% in 2019 to 17.9% in 2021.
Although many employees continue to work from home, a significant share of workers are now commuting into the office at least some of the time. Most businesses are now back to normal operations as well. Due to both of these factors, in 2021, public transit ridership rose to more than 70% of pre-pandemic levels. However, public transit usage varies significantly by location. When considering where to live, the availability of public transportation is often an important deciding factor. At the state level, New York residents average the most public transit trips per year at 99.9 trips per person. Other states have much fewer public transportation options. In both Mississippi and Alabama, residents average less than one public transit trip per year.
To determine the locations with the best public transportation, researchers at HireAHelper analyzed the latest data from the Federal Transit Administration and from the U.S. Census Bureau. The researchers ranked metros according to a composite score based on the following factors and weights:
- Annual public transit trips per resident (25%)
- Share of workers who commute by public transit (20%)
- Average commute time difference (public transit versus private) (15%)
- Share of passenger miles traveled using electric power (15%)
- Mechanical failures (breakdowns) per passenger mile (10%)
- Share of stations that are ADA accessible (10%)
- Safety and security incidents per passenger mile (5%)
Based on their composite scores, here are the U.S. metropolitan areas with the best public transportation.
Large Metros With the Best Public Transportation

Photo Credit: Chris Romero / Shutterstock
15. Denver-Aurora-Lakewood, CO
- Composite score: 79.9
- Annual public transit trips per resident: 16.1
- Share of workers who commute by public transit: 1.7%
- Share of stations that are ADA accessible: 100.0%
- Share of passenger miles traveled using electric power: 30.6%
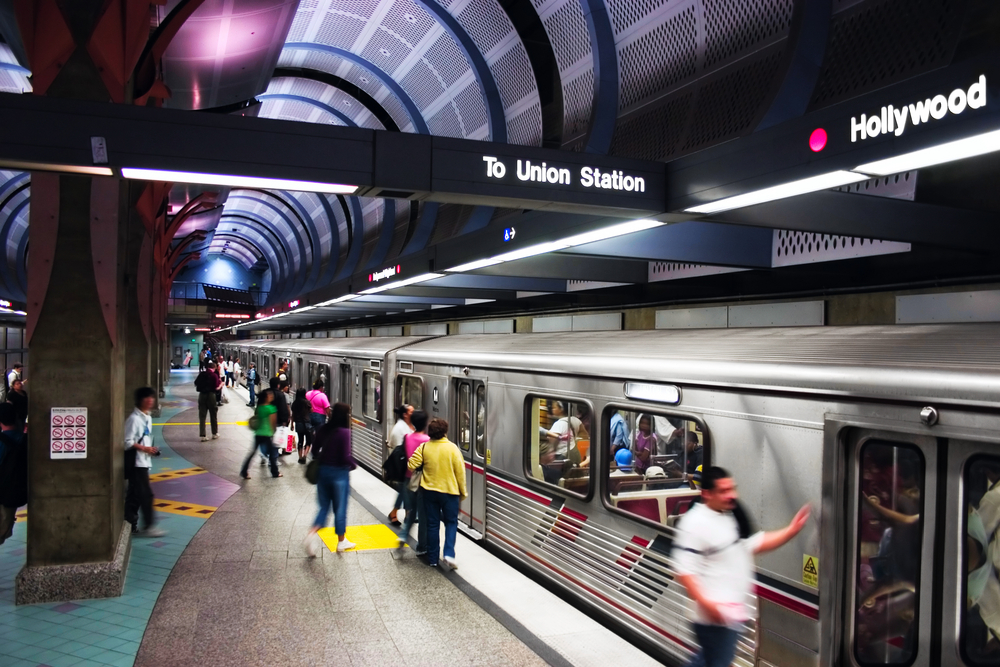
Photo Credit: Yusef El-Mansouri / Shutterstock
14. Los Angeles-Long Beach-Anaheim, CA
- Composite score: 81.4
- Annual public transit trips per resident: 20.8
- Share of workers who commute by public transit: 2.8%
- Share of stations that are ADA accessible: 97.2%
- Share of passenger miles traveled using electric power: 11.2%

Photo Credit: Wangkun Jia / Shutterstock
13. Providence-Warwick, RI-MA
- Composite score: 82.8
- Annual public transit trips per resident: 23.7
- Share of workers who commute by public transit: 1.2%
- Share of stations that are ADA accessible: 81.3%
- Share of passenger miles traveled using electric power: 27.0%

Photo Credit: cdrin / Shutterstock
12. Seattle-Tacoma-Bellevue, WA
- Composite score: 83.3
- Annual public transit trips per resident: 30.3
- Share of workers who commute by public transit: 3.0%
- Share of stations that are ADA accessible: 99.2%
- Share of passenger miles traveled using electric power: 9.6%

Photo Credit: Sam Wagner / Shutterstock
11. Minneapolis-St. Paul-Bloomington, MN-WI
- Composite score: 83.9
- Annual public transit trips per resident: 13.7
- Share of workers who commute by public transit: 1.7%
- Share of stations that are ADA accessible: 100.0%
- Share of passenger miles traveled using electric power: 7.0%

Photo Credit: f11photo / Shutterstock
10. Pittsburgh, PA
- Composite score: 85.3
- Annual public transit trips per resident: 12.7
- Share of workers who commute by public transit: 2.4%
- Share of stations that are ADA accessible: 66.0%
- Share of passenger miles traveled using electric power: 4.2%
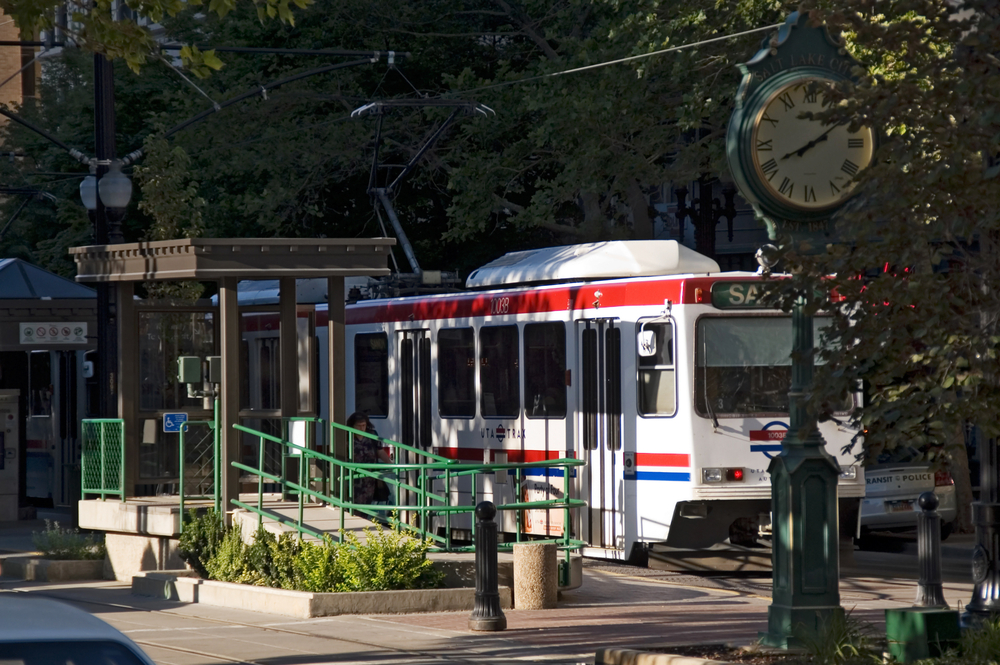
Photo Credit: Boykov / Shutterstock
9. Salt Lake City, UT
- Composite score: 86.8
- Annual public transit trips per resident: 16.4
- Share of workers who commute by public transit: 2.0%
- Share of stations that are ADA accessible: 100.0%
- Share of passenger miles traveled using electric power: 17.9%

Photo Credit: Jon Bilous / Shutterstock
8. Boston-Cambridge-Newton, MA-NH
- Composite score: 87.3
- Annual public transit trips per resident: 21.4
- Share of workers who commute by public transit: 5.6%
- Share of stations that are ADA accessible: 84.1%
- Share of passenger miles traveled using electric power: 23.0%

Photo Credit: wonderlustpicstravel / Shutterstock
7. Chicago-Naperville-Elgin, IL-IN-WI
- Composite score: 88.2
- Annual public transit trips per resident: 25.6
- Share of workers who commute by public transit: 4.8%
- Share of stations that are ADA accessible: 77.0%
- Share of passenger miles traveled using electric power: 38.5%

Photo Credit: Siyi H / Shutterstock
6. Portland-Vancouver-Hillsboro, OR-WA
- Composite score: 89.0
- Annual public transit trips per resident: 23.9
- Share of workers who commute by public transit: 2.3%
- Share of stations that are ADA accessible: 100.0%
- Share of passenger miles traveled using electric power: 19.4%

Photo Credit: Sergey Novikov / Shutterstock
5. Baltimore-Columbia-Towson, MD
- Composite score: 89.6
- Annual public transit trips per resident: 23.0
- Share of workers who commute by public transit: 2.6%
- Share of stations that are ADA accessible: 93.6%
- Share of passenger miles traveled using electric power: 29.3%

Photo Credit: canadastock / Shutterstock
4. San Francisco-Oakland-Berkeley, CA
- Composite score: 91.2
- Annual public transit trips per resident: 21.4
- Share of workers who commute by public transit: 4.9%
- Share of stations that are ADA accessible: 93.0%
- Share of passenger miles traveled using electric power: 32.0%

Photo Credit: William Perugini / Shutterstock
3. New York-Newark-Jersey City, NY-NJ-PA
- Composite score: 91.2
- Annual public transit trips per resident: 85.8
- Share of workers who commute by public transit: 19.0%
- Share of stations that are ADA accessible: 53.1%
- Share of passenger miles traveled using electric power: 49.1%

Photo Credit: Sean Pavone / Shutterstock
2. Philadelphia-Camden-Wilmington, PA-NJ-DE-MD
- Composite score: 92.4
- Annual public transit trips per resident: 20.7
- Share of workers who commute by public transit: 4.7%
- Share of stations that are ADA accessible: 53.2%
- Share of passenger miles traveled using electric power: 29.4%

Photo Credit: Kamira / Shutterstock
1. Washington-Arlington-Alexandria, DC-VA-MD-WV
- Composite score: 95.9
- Annual public transit trips per resident: 22.2
- Share of workers who commute by public transit: 4.1%
- Share of stations that are ADA accessible: 93.8%
- Share of passenger miles traveled using electric power: 28.7%
Detailed Findings & Methodology
To determine the locations with the best public transportation, researchers at HireAHelper analyzed the latest data from the Federal Transit Administration’s 2021 National Transit Database and from the U.S. Census Bureau’s 2021 American Community Survey. The researchers ranked metros according to a composite score based on the following factors and weights:
- Annual public transit trips per resident (25%)
- Share of workers who commute by public transit (20%)
- Average commute time difference (public transit versus private) (15%)
- Share of passenger miles traveled using electric power (15%)
- Mechanical failures (breakdowns) per passenger mile (10%)
- Share of stations that are ADA accessible (10%)
- Safety and security incidents per passenger mile (5%)
Only locations with complete data were included in the analysis. To improve relevance, only metropolitan areas with at least 100,000 people were included in the analysis. Additionally, metro areas were grouped into the following cohorts based on population size:
- Small metros: 100,000–349,999
- Midsize metros: 350,000–999,999
- Large metros: more than 1,000,000