
Photo Credit: Blue Planet Studio / Shutterstock
Labor unions in the United States have faced major challenges over the last several decades. Anti-union initiatives by employers, the growing prominence of the gig economy, and shifting labor laws, among other factors, all contributed to a steady decline in union membership. But recently, interest in unionization has resurfaced. The narrowly averted UPS strike and notable strikes by writers and actors in Hollywood have garnered major interest and made headlines nationwide. Desires for better compensation and working conditions have once again taken center stage.
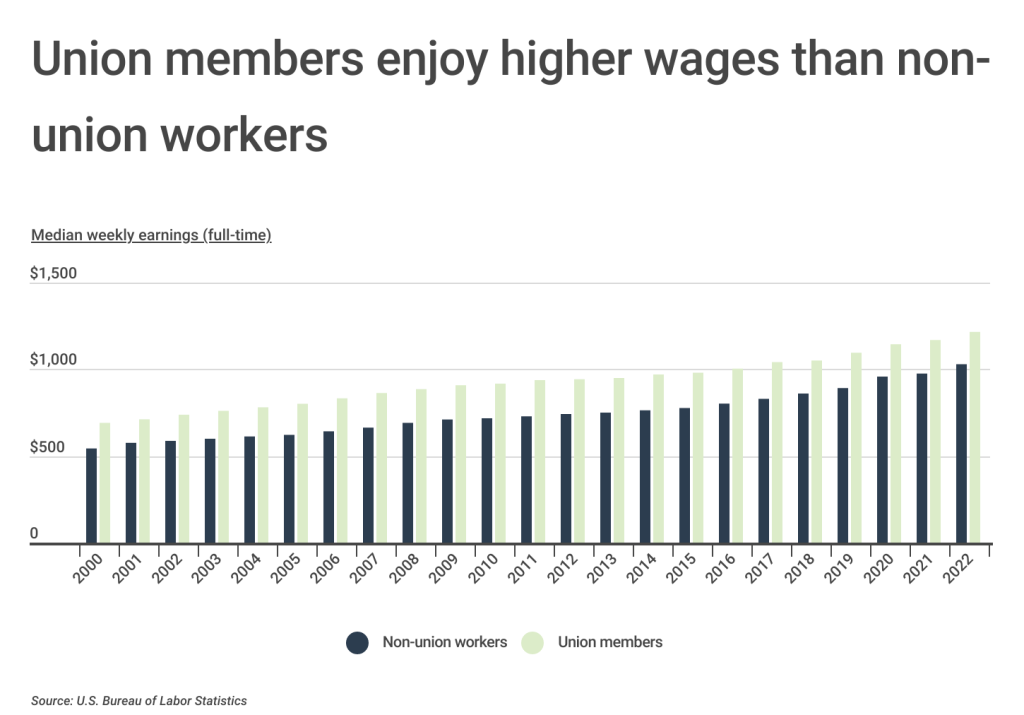
Union workers not only have more protection from unemployment, they also enjoy wage premiums over non-union workers. Data from the Bureau of Labor Statistics found that in 2022, the median wage for full-time union workers was $1,216 per week compared to only $1,029 per week for full-time non-union workers. In other words, union workers earn about 18% more than their non-union counterparts, which for the typical worker, is nearly $10,000 in additional compensation annually. A major reason for this wage disparity is union workers’ ability to benefit from the union’s collective bargaining power, rather than relying on individual negotiations with an employer.
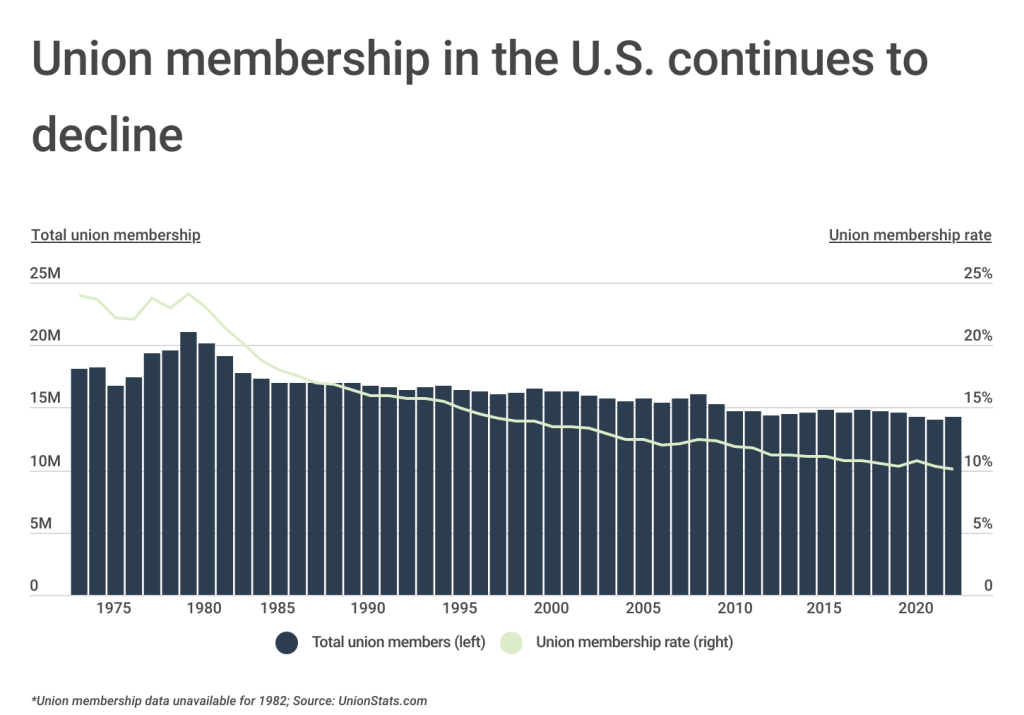
Although union members on average earn more than their non-union worker counterparts, union membership in the U.S. has declined significantly over the past several decades. This downward trend is in part due to more states passing so-called “right-to-work” laws, and changes in the composition of the U.S. labor force. In 1979, the union membership rate peaked at just over 24% of U.S. employees. By contrast, only 10.1% of American workers were union members in 2022. In nominal numbers, union membership accounted for roughly 14.3 million workers in 2022, approximately 6.7 million fewer than the 1979 peak.
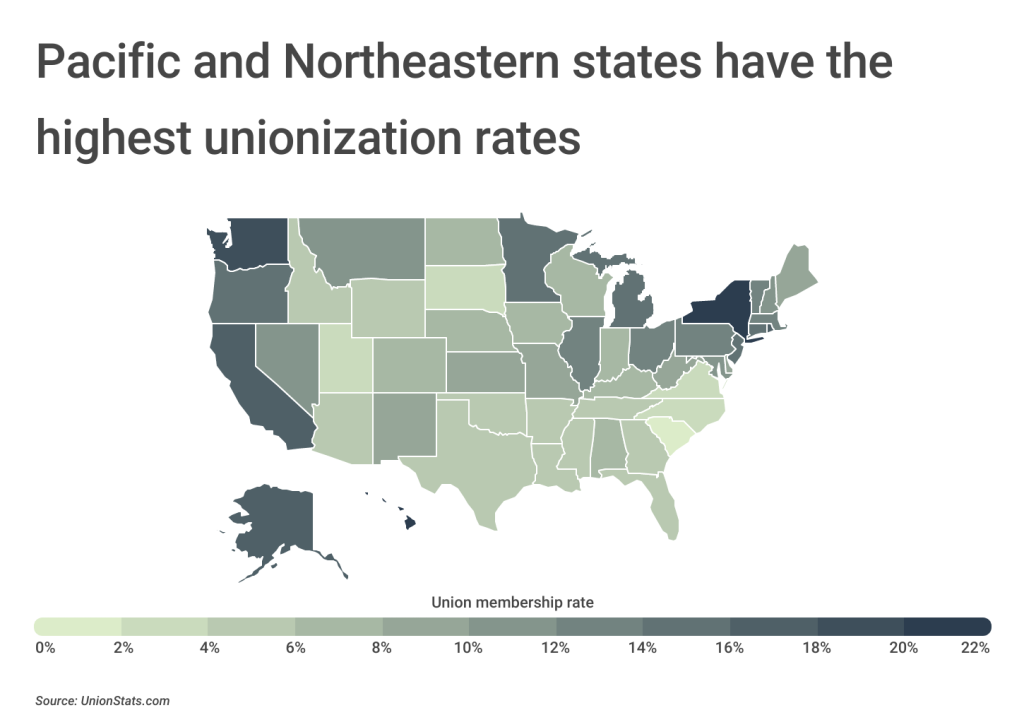
Although union membership rates are declining nationally, differences in local economies, politics, and legislation can impact union membership rates at the state level. Coastal states such as Hawaii, New York, and Washington have the highest membership rates, at 21.7%, 20.6%, and 18.0%, respectively. Conversely, Southern states—many of which have right-to-work legislation enacted—tend to have lower union membership rates. Southern states such as South Carolina (1.7%), North Carolina (2.8%), Virginia (3.7%), Texas (4.1%), Georgia (4.4%), and Florida (4.5%) all rank in the bottom 10 states for union membership.
To determine the most unionized locations in America, researchers at Construction Coverage, a website that provides construction software and insurance reviews, analyzed data from UnionStats.com and the U.S. Bureau of Labor Statistics. The researchers ranked metropolitan areas according to total union members as a percentage of total employment. In addition to union membership, the researchers also included statistics on union representation, which is the share of workers whose terms of work are collectively negotiated (whether or not they are union members).
Here are the most unionized U.S. metropolitan areas.
The Most Unionized Large Metros

Photo Credit: Sean Pavone / Shutterstock
15. Los Angeles-Long Beach-Anaheim, CA
- Union membership rate: 13.6%
- Union representation rate: 14.7%
- Workers who are members of unions: 736,464
- Workers who are represented by unions: 792,202
- Total employment: 5,399,876

Photo Credit: Checubus / Shutterstock
14. Minneapolis-St. Paul-Bloomington, MN-WI
- Union membership rate: 13.7%
- Union representation rate: 14.6%
- Workers who are members of unions: 270,873
- Workers who are represented by unions: 288,625
- Total employment: 1,982,212

Photo Credit: Bogdan Vacarciuc / Shutterstock
13. San Francisco-Oakland-Berkeley, CA
- Union membership rate: 13.7%
- Union representation rate: 14.3%
- Workers who are members of unions: 295,446
- Workers who are represented by unions: 307,971
- Total employment: 2,158,220
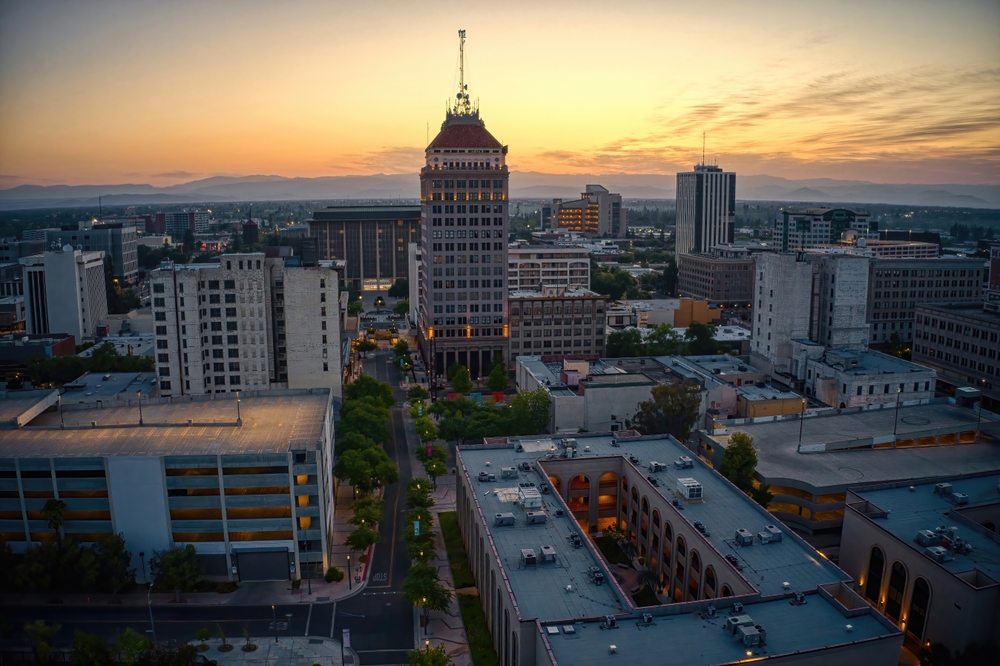
Photo Credit: Jacob Boomsma / Shutterstock
12. Fresno, CA
- Union membership rate: 14.2%
- Union representation rate: 17.4%
- Workers who are members of unions: 49,396
- Workers who are represented by unions: 60,762
- Total employment: 348,751

Photo Credit: Zack Frank / Shutterstock
11. Philadelphia-Camden-Wilmington, PA-NJ-DE-MD
- Union membership rate: 14.4%
- Union representation rate: 15.5%
- Workers who are members of unions: 406,200
- Workers who are represented by unions: 436,670
- Total employment: 2,815,535
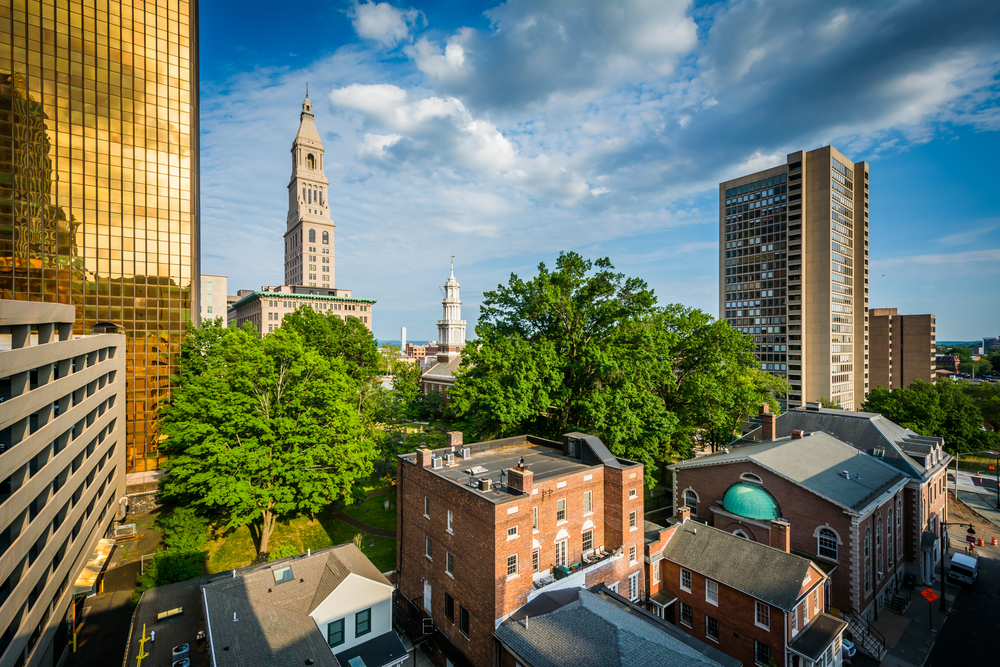
Photo Credit: Jon Bilous / Shutterstock
10. Hartford-East Hartford-Middletown, CT
- Union membership rate: 14.5%
- Union representation rate: 16.0%
- Workers who are members of unions: 81,747
- Workers who are represented by unions: 90,086
- Total employment: 562,300

Photo Credit: Lucky-photographer / Shutterstock
9. San Diego-Chula Vista-Carlsbad, CA
- Union membership rate: 15.6%
- Union representation rate: 17.6%
- Workers who are members of unions: 218,491
- Workers who are represented by unions: 247,531
- Total employment: 1,402,461
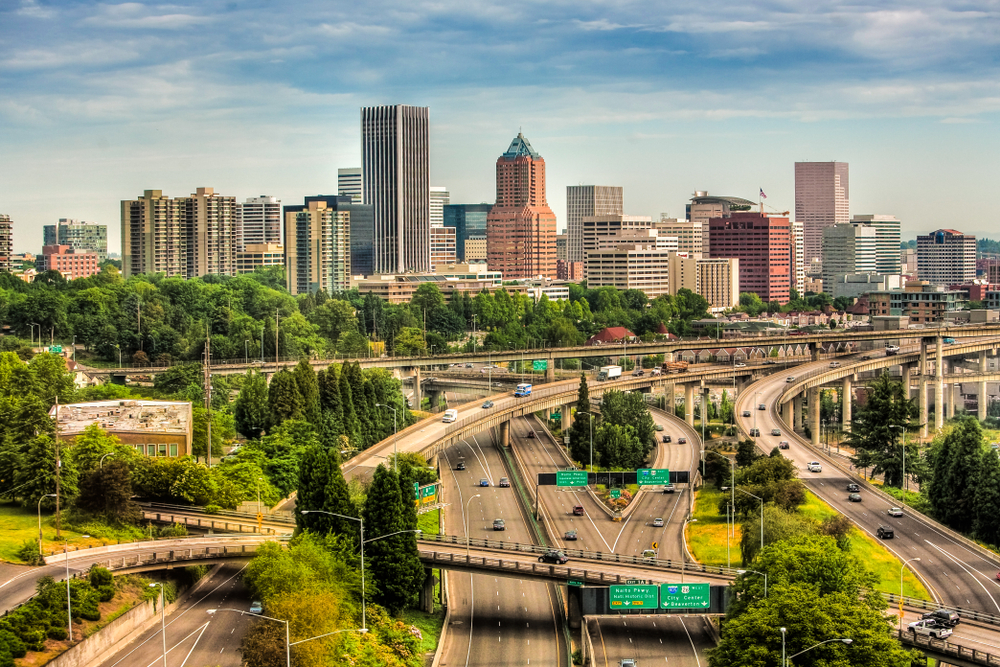
Photo Credit: Bob Pool / Shutterstock
8. Portland-Vancouver-Hillsboro, OR-WA
- Union membership rate: 15.8%
- Union representation rate: 16.8%
- Workers who are members of unions: 180,926
- Workers who are represented by unions: 193,133
- Total employment: 1,147,550
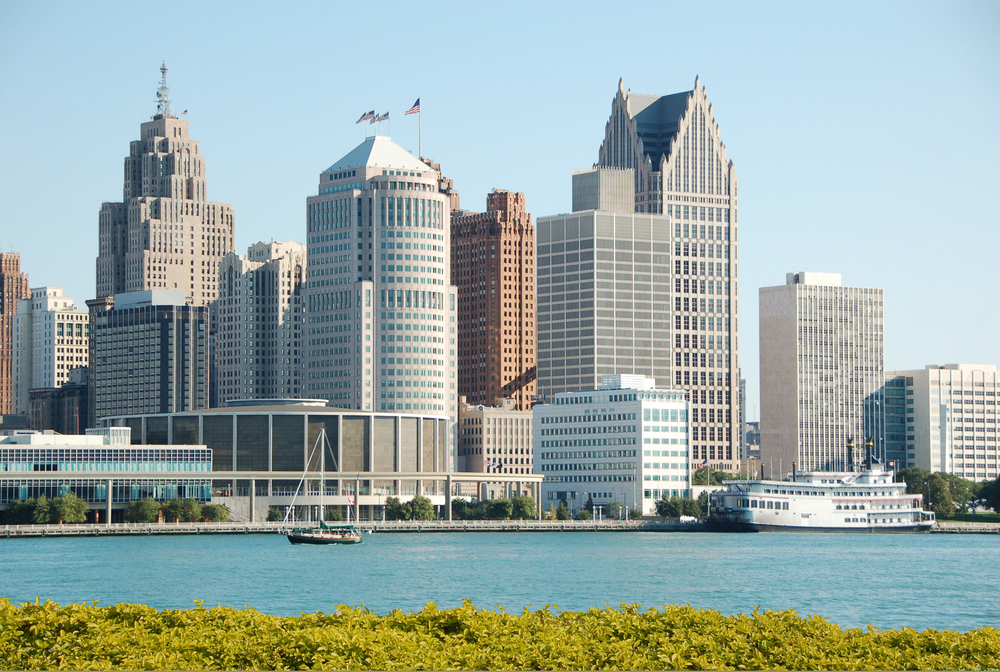
Photo Credit: Ivan Cholakov / Shutterstock
7. Detroit-Warren-Dearborn, MI
- Union membership rate: 15.8%
- Union representation rate: 16.8%
- Workers who are members of unions: 306,407
- Workers who are represented by unions: 327,113
- Total employment: 1,943,364

Photo Credit: Richard Cavalleri / Shutterstock
6. Providence-Warwick, RI-MA
- Union membership rate: 16.2%
- Union representation rate: 18.0%
- Workers who are members of unions: 122,477
- Workers who are represented by unions: 136,074
- Total employment: 755,483
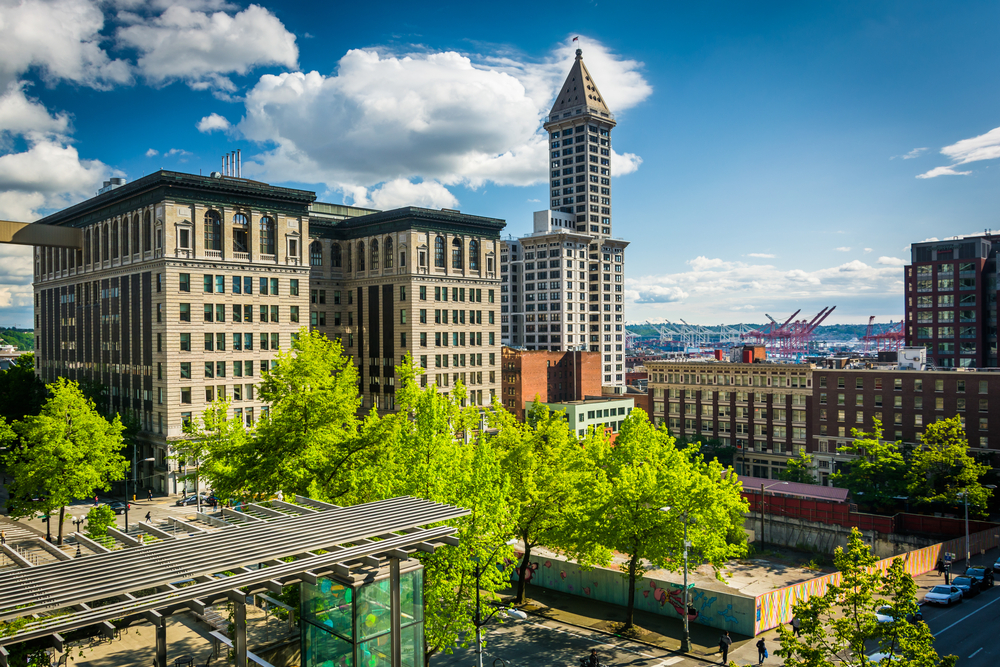
Photo Credit: ESB Professional / Shutterstock
5. Seattle-Tacoma-Bellevue, WA
- Union membership rate: 16.6%
- Union representation rate: 18.0%
- Workers who are members of unions: 325,707
- Workers who are represented by unions: 352,346
- Total employment: 1,960,848

Photo Credit: Matt Gush / Shutterstock
4. Riverside-San Bernardino-Ontario, CA
- Union membership rate: 17.8%
- Union representation rate: 22.2%
- Workers who are members of unions: 329,984
- Workers who are represented by unions: 411,934
- Total employment: 1,855,064

Photo Credit: Ingus Kruklitis / Shutterstock
3. New York-Newark-Jersey City, NY-NJ-PA
- Union membership rate: 18.1%
- Union representation rate: 19.5%
- Workers who are members of unions: 1,606,871
- Workers who are represented by unions: 1,722,399
- Total employment: 8,854,530
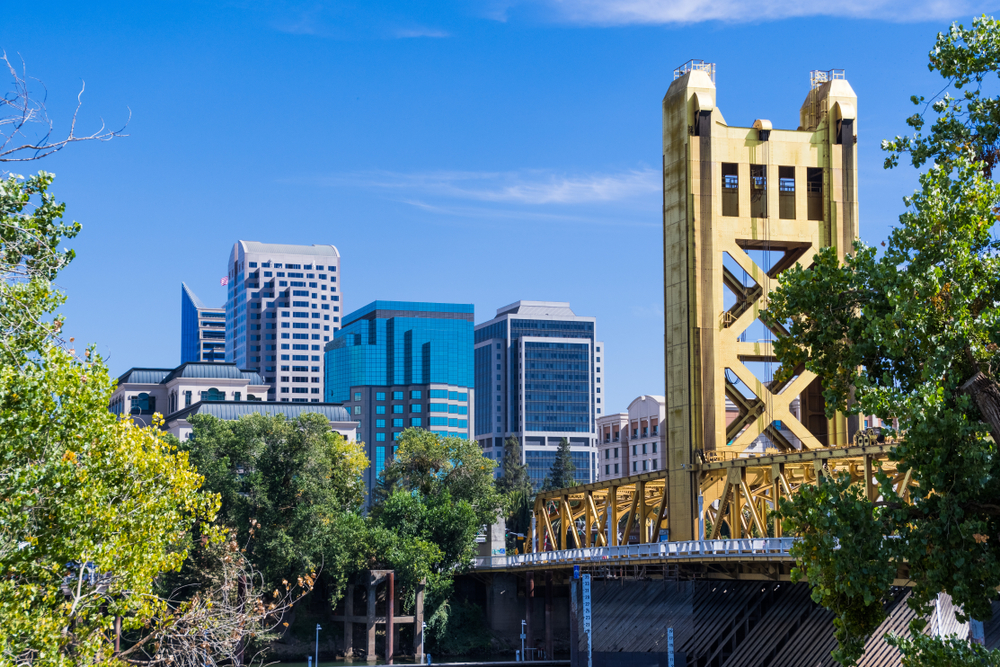
Photo Credit: Sundry Photography / Shutterstock
2. Sacramento-Roseville-Folsom, CA
- Union membership rate: 19.7%
- Union representation rate: 21.8%
- Workers who are members of unions: 190,653
- Workers who are represented by unions: 211,139
- Total employment: 968,122
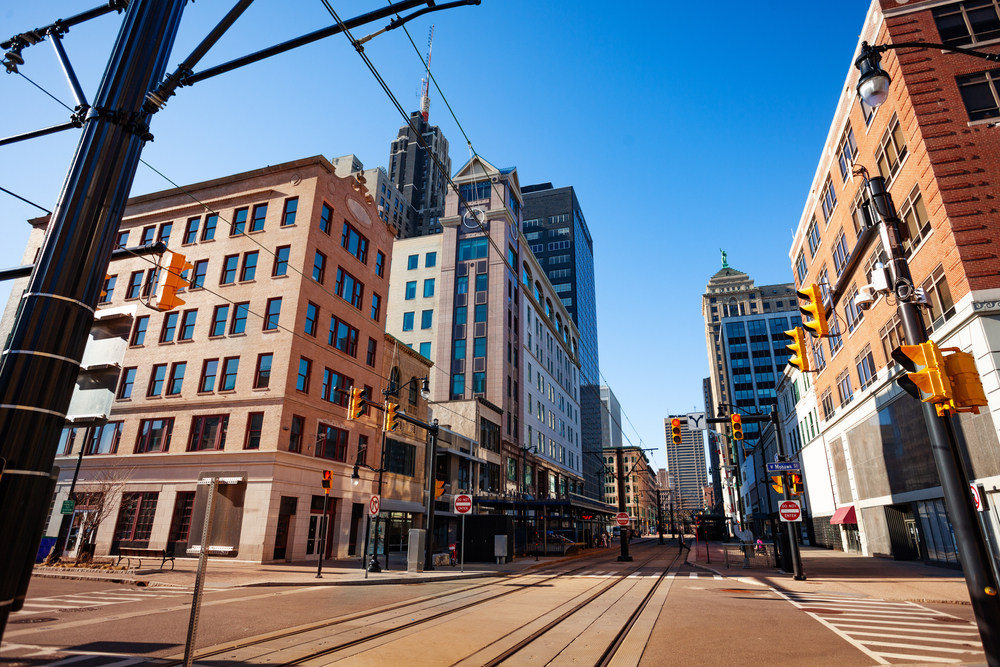
Photo Credit: Sergey Novikov / Shutterstock
1. Buffalo-Cheektowaga, NY
- Union membership rate: 23.5%
- Union representation rate: 25.8%
- Workers who are members of unions: 108,420
- Workers who are represented by unions: 119,015
- Total employment: 460,560
Detailed Findings & Methodology
To determine the most unionized metros in America, researchers at Construction Coverage analyzed data from UnionStats.com and the U.S. Census Bureau’s Population and Housing Estimates. The researchers ranked metropolitan areas according to total union members as a percentage of total employment. In addition to union membership, the researchers also included statistics on union representation, which is the share of workers whose terms of work are collectively negotiated (whether or not they are union members).
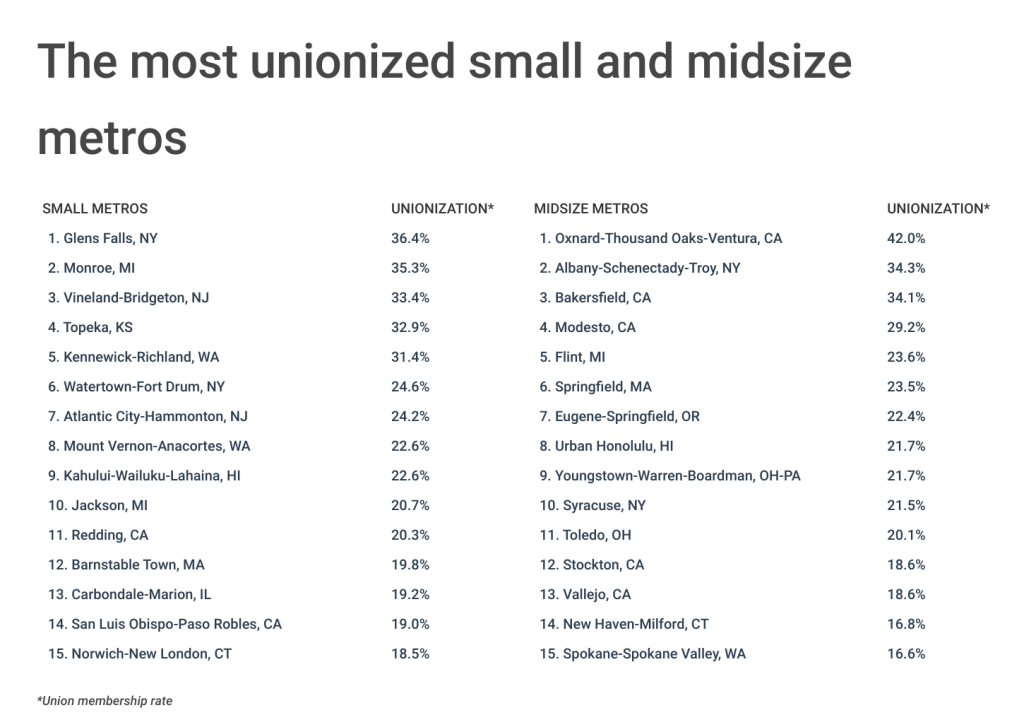
Only metropolitan areas with available data and with at least 100,000 people were included in the analysis. Additionally, metro areas were grouped into the following cohorts based on population size:
- Small metros: 100,000–349,999
- Midsize metros: 350,000–999,999
- Large metros: 1,000,000 or more
For complete results on more than 250 metros and all 50 states, see The Most Unionized Cities in America on Construction Coverage.