The beginning of the fall season means that Halloween is on its way. Scary movies, spooky costumes, and pumpkin carving are all time-honored Halloween traditions, but trick or treating—and the accompanying appetite for candy—is perhaps the season’s most distinguishing feature.
Recent research from the National Retail Federation found that handing out candy is the most common way consumers celebrate the holiday, with more than two-thirds of households planning to do so in 2023. And despite a steep rise in candy prices over the past two years, the demand for Halloween candy in the U.S. shows no sign of waning. Americans are projected to spend a substantial $3.6 billion this year to stock up on their Halloween treats.
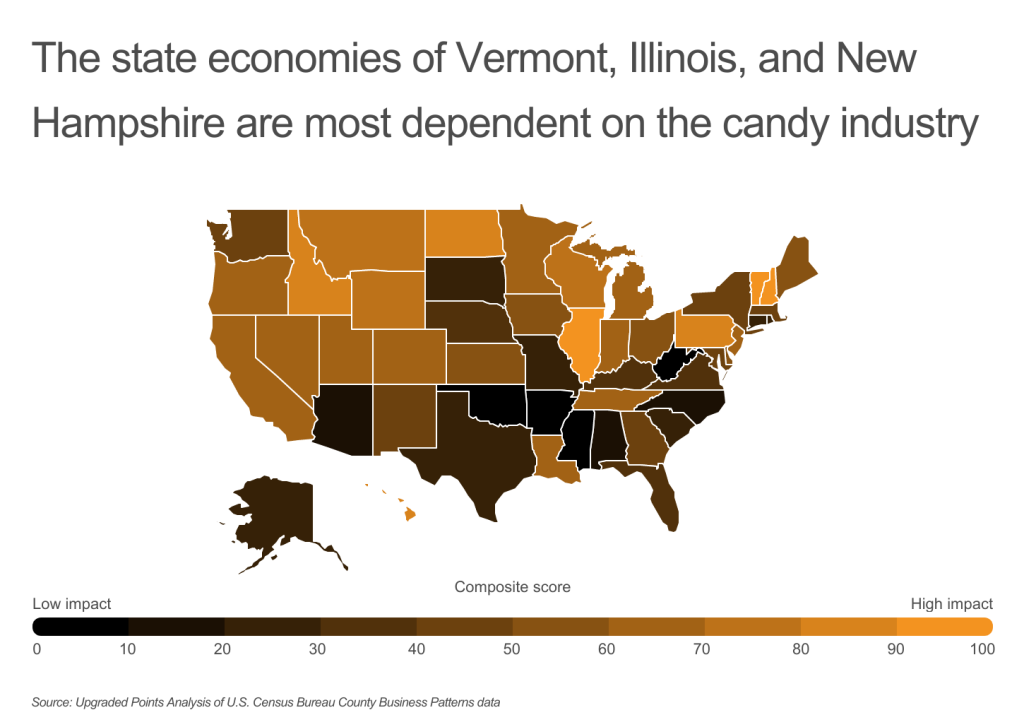
With such a major economic impact, Halloween stands as one of the primary drivers of candy sales in the U.S. However, the country’s candy production industry plays a role that extends far beyond a single holiday, exerting a noteworthy influence on the economies of various states and localities. In these designated “candy capitals,” confectionery production and retail account for a disproportionate number of local jobs and businesses.

To determine which local economies are most reliant on the candy industry, researchers at Upgraded Points created a composite score that factored in the concentration of employment, payroll, and locations of candy producers and candy retail stores compared to the national average. For example, while California—the birthplace of Ghirardelli, See’s, and Jelly Belly, among others—leads the nation in overall candy industry employment, the percentage of California workers in the candy industry is only about 1.4 times higher than the national average.
On the other hand, while Vermont employs a much smaller number of candy workers overall, the concentration of candy workers in Vermont is nearly 4.5 times the national average. Vermont—home of Lake Champlain Chocolates and a wide variety of maple sugar candy producers—also boasts the highest concentration of candy businesses in the nation, making it the U.S. state economy most dependent on the candy industry. Other top-ranked state candy capitals include Illinois—home of Ferrara Candy Company, Tootsie Roll, and Wrigley’s—as well as New Hampshire and Pennsylvania.
At the local level, the nation’s prominent candy capitals are a mix of small towns with one or two large candy manufacturing brands—like the Vallejo-Fairfield, California metro, which is home to Jelly Belly, or the Harrisburg-Carlisle, Pennsylvania metro that houses Hershey—as well as popular tourist hotspots, like beach towns that produce saltwater taffy, among other popular boardwalk candies.
Here are the top 15 candy capitals of the U.S. at the metro level.
The Candy Capitals of America

Photo Credit: Sean Pavone / Shutterstock
15. Savannah, GA
- Composite score: 83.33
- Concentration of candy industry employment: 3.5x
- Concentration of candy industry payroll: 5.7x
- Concentration of candy businesses: 1.8x

Photo Credit: Gary C. Tognoni / Shutterstock
14. Billings, MT
- Composite score: 84.30
- Concentration of candy industry employment: 2.6x
- Concentration of candy industry payroll: 3.4x
- Concentration of candy businesses: 2.3x

Photo Credit: Flying Koala Photography / Shutterstock
13. Salisbury, MD-DE
- Composite score: 85.30
- Concentration of candy industry employment: 2.1x
- Concentration of candy industry payroll: 2.3x
- Concentration of candy businesses: 4.1x

Photo Credit: Nejdet Duzen / Shutterstock
12. Rockford, IL
- Composite score: 85.80
- Concentration of candy industry employment: 9.2x
- Concentration of candy industry payroll: 16.1x
- Concentration of candy businesses: 1.4x

Photo Credit: Cheng Cheng / Shutterstock
11. Napa, CA
- Composite score: 88.50
- Concentration of candy industry employment: 3.7x
- Concentration of candy industry payroll: 3.7x
- Concentration of candy businesses: 2.9x

Photo Credit: Jon Bilous / Shutterstock
10. Harrisburg-Carlisle, PA
- Composite score: 89.47
- Concentration of candy industry employment: 9.8x
- Concentration of candy industry payroll: 15.1x
- Concentration of candy businesses: 1.6x

Photo Credit: Jon Bilous / Shutterstock
9. Reading, PA
- Composite score: 92.17
- Concentration of candy industry employment: 7.0x
- Concentration of candy industry payroll: 9.1x
- Concentration of candy businesses: 2.3x

Photo Credit: Jacob Boomsma / Shutterstock
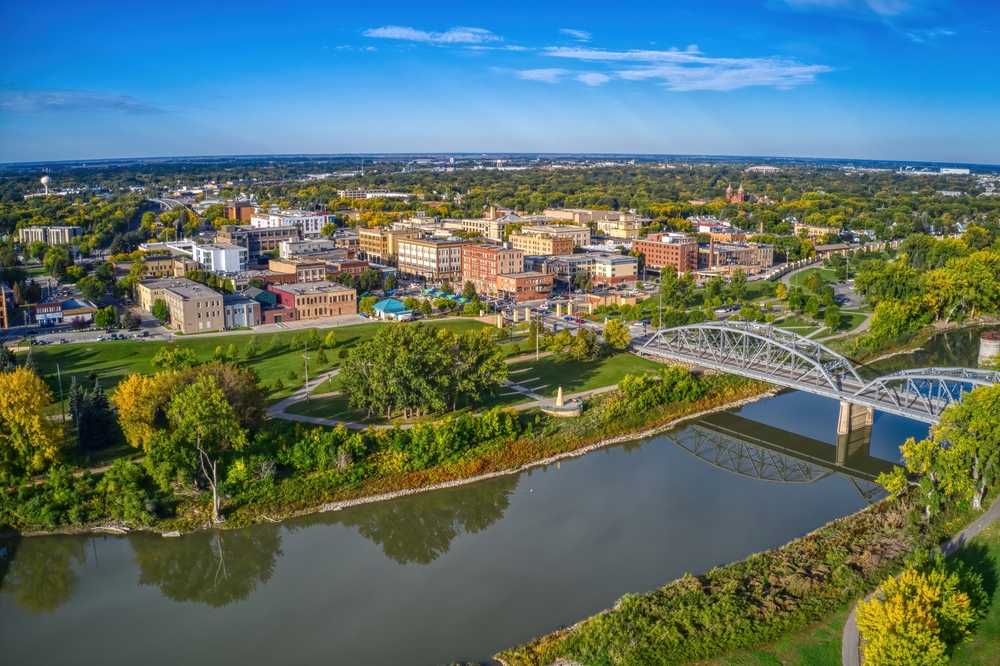
8. Grand Forks, ND-MN
- Composite score: 92.40
- Concentration of candy industry employment: 24.8x
- Concentration of candy industry payroll: 37.5x
- Concentration of candy businesses: 1.8x

Photo Credit: arburkholder / Shutterstock
7. Lancaster, PA
- Composite score: 92.67
- Concentration of candy industry employment: 6.3x
- Concentration of candy industry payroll: 9.4x
- Concentration of candy businesses: 2.4x

Photo Credit: Michael Shanafelt / Shutterstock
6. Altoona, PA
- Composite score: 93.37
- Concentration of candy industry employment: 5.5x
- Concentration of candy industry payroll: 5.9x
- Concentration of candy businesses: 3.6x

Photo Credit: FotosForTheFuture / Shutterstock
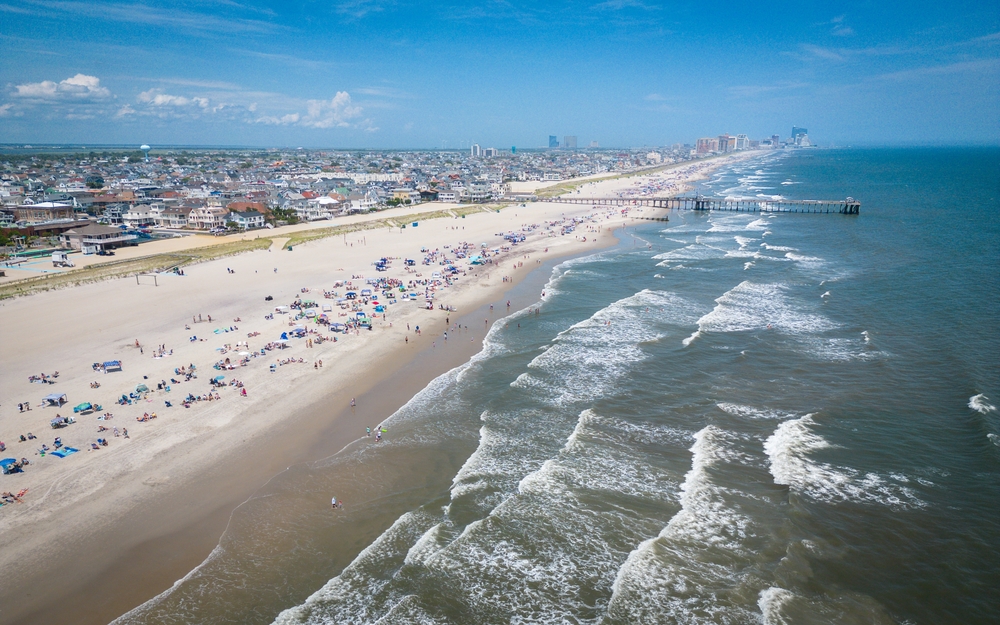
5. Ocean City, NJ
- Composite score: 93.87
- Concentration of candy industry employment: 5.2x
- Concentration of candy industry payroll: 7.1x
- Concentration of candy businesses: 10.2x

Photo Credit: Noel Biesecker / Shutterstock
4. Scranton–Wilkes-Barre–Hazleton, PA
- Composite score: 94.37
- Concentration of candy industry employment: 7.0x
- Concentration of candy industry payroll: 9.4x
- Concentration of candy businesses: 3.2x

Photo Credit: Chris LaBasco / Shutterstock
3. Vallejo-Fairfield, CA
- Composite score: 94.60
- Concentration of candy industry employment: 8.0x
- Concentration of candy industry payroll: 10.9x
- Concentration of candy businesses: 2.8x

Photo Credit: Sundry Photography / Shutterstock
2. Santa Cruz-Watsonville, CA
- Composite score: 95.13
- Concentration of candy industry employment: 11.1x
- Concentration of candy industry payroll: 17.9x
- Concentration of candy businesses: 2.3x

Photo Credit: Allan Wood Photography / Shutterstock
1. Burlington-South Burlington, VT
- Composite score: 95.83
- Concentration of candy industry employment: 8.9x
- Concentration of candy industry payroll: 8.3x
- Concentration of candy businesses: 3.5x
Methodology
The data used in this analysis is from the U.S. Census Bureau’s County Business Patterns survey, which includes statistical estimates for U.S. businesses with employees. To determine the candy capitals of the U.S., researchers at Upgraded Points created a composite score for each location based on the concentrations of employment, payroll, and establishments in the candy industry relative to the national averages. For the purpose of this study, both “Sugar and confectionery product manufacturing” businesses and “Confectionery and nut stores” were considered. Additionally, only locations with positive values across the resulting metrics were included.
For complete results, see The Candy Capitals of the U.S. on Upgraded Points.
