
While the U.S. real estate market appears to finally be cooling down, home price growth has been a defining economic trend in recent years. Over the past decade, which has included recoveries from both the Great Recession and the COVID-19 recession, U.S. home values grew by more than 95%. In comparison, average hourly earnings saw a modest 44% increase, while the Consumer Price Index rose by just 33%. Consequently, housing affordability has taken a hit, while homeowners have seen substantial gains in their real estate wealth.
Home Price Trends Following Economic Recessions
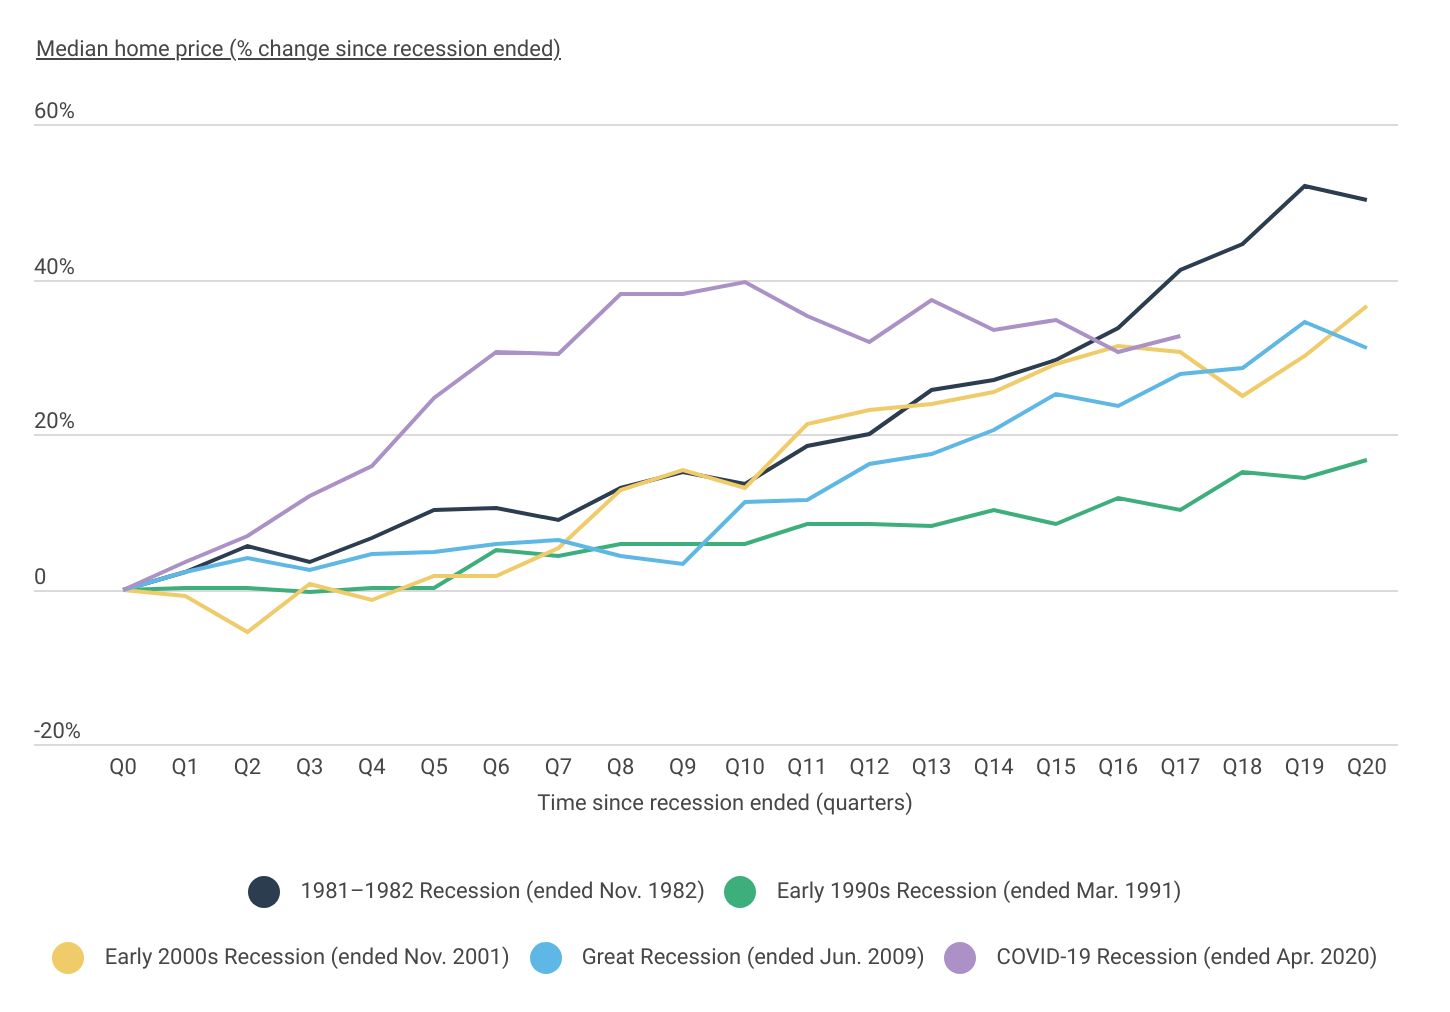
Home price growth after the COVID-19 recession was unprecedented but has now regressed to historical norms
Source: Construction Coverage analysis of U.S. Housing & Urban Development data | Image Credit: Construction Coverage
Recent home price increases, though intensified by the unique circumstances of the COVID-19 pandemic, reflect a broader trend of above-average growth following economic recessions. Historically, U.S. housing markets have rebounded strongly after downturns, with median prices rising by an average of 33.6% over five years (20 quarters). Following the brief 2020 recession, home prices surged by an unprecedented 40% within just over two years but have since stabilized. By the third quarter of 2024—17 quarters after the recession officially ended—cumulative growth stands at 32.6%, closely mirroring historical patterns observed over similar recovery periods.
Despite recent declines in sale prices, homebuyers still haven’t experienced much in the way of financial relief. Persistent inflation continues to erode purchasing power, and mortgage rates above 6% have kept monthly payments near record highs.
Home Price Growth by State Over the Past Decade
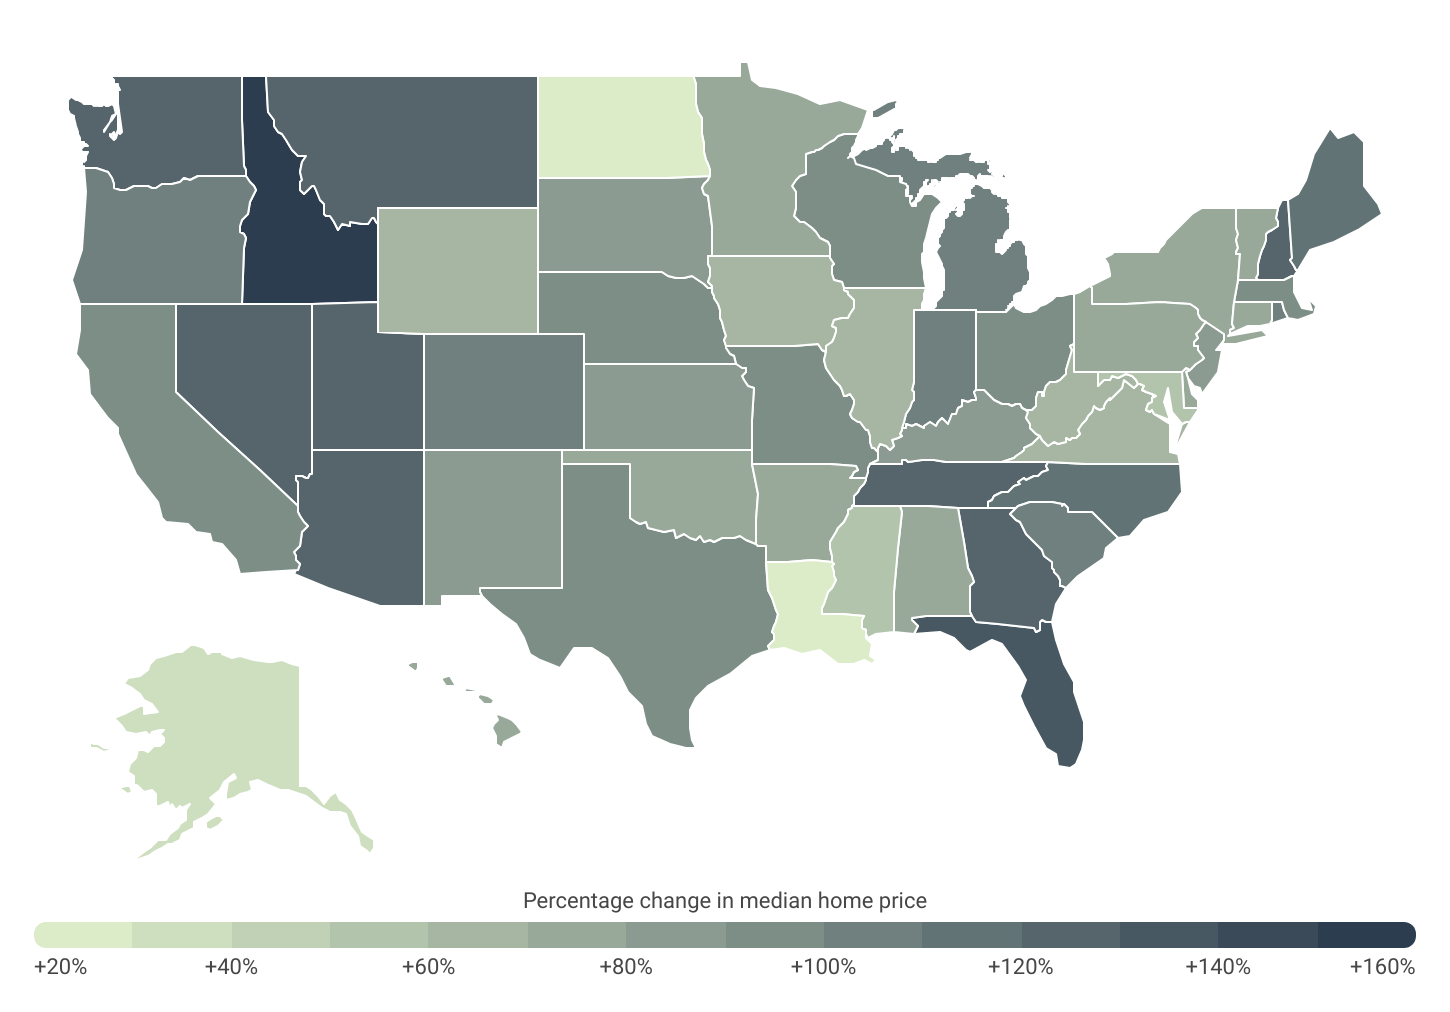
States in the West and South Atlantic saw the most significant home price growth over the past decade
Source: Construction Coverage analysis of Zillow data | Image Credit: Construction Coverage
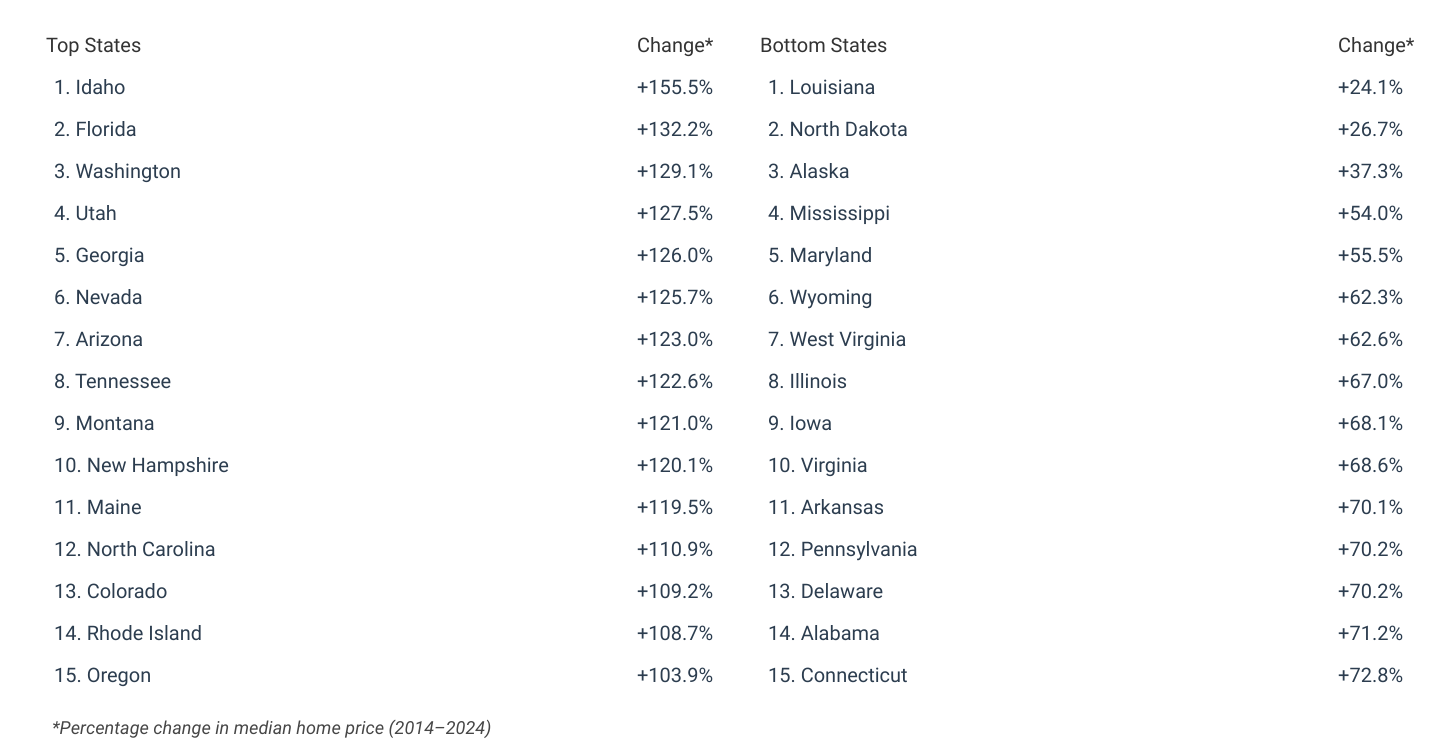
The trajectory of economic recovery post-recession is uneven across the nation, and this trend has held true in the wake of both the Great Recession and the COVID-19 pandemic. The most substantial increases in home prices have been concentrated in Western states and select states in the Southeast. Since 2014, Idaho and Florida have witnessed the most significant growth, with median home prices increasing by 155.5% and 132.2%, respectively. Other top states include Washington (+129.1%), Utah (+127.5%), Georgia (+126.0%), Nevada (+125.7%), Arizona (+123.0%), and Tennessee (+122.6%).
Conversely, Louisiana (+24.1%), North Dakota (+26.7%), and Alaska (+37.3%) saw home price growth barely keeping pace with inflation over the past decade. Generally, the Midwest, along with certain pockets of the South and Northeast, reported the slowest growth in home prices nationally during this period.
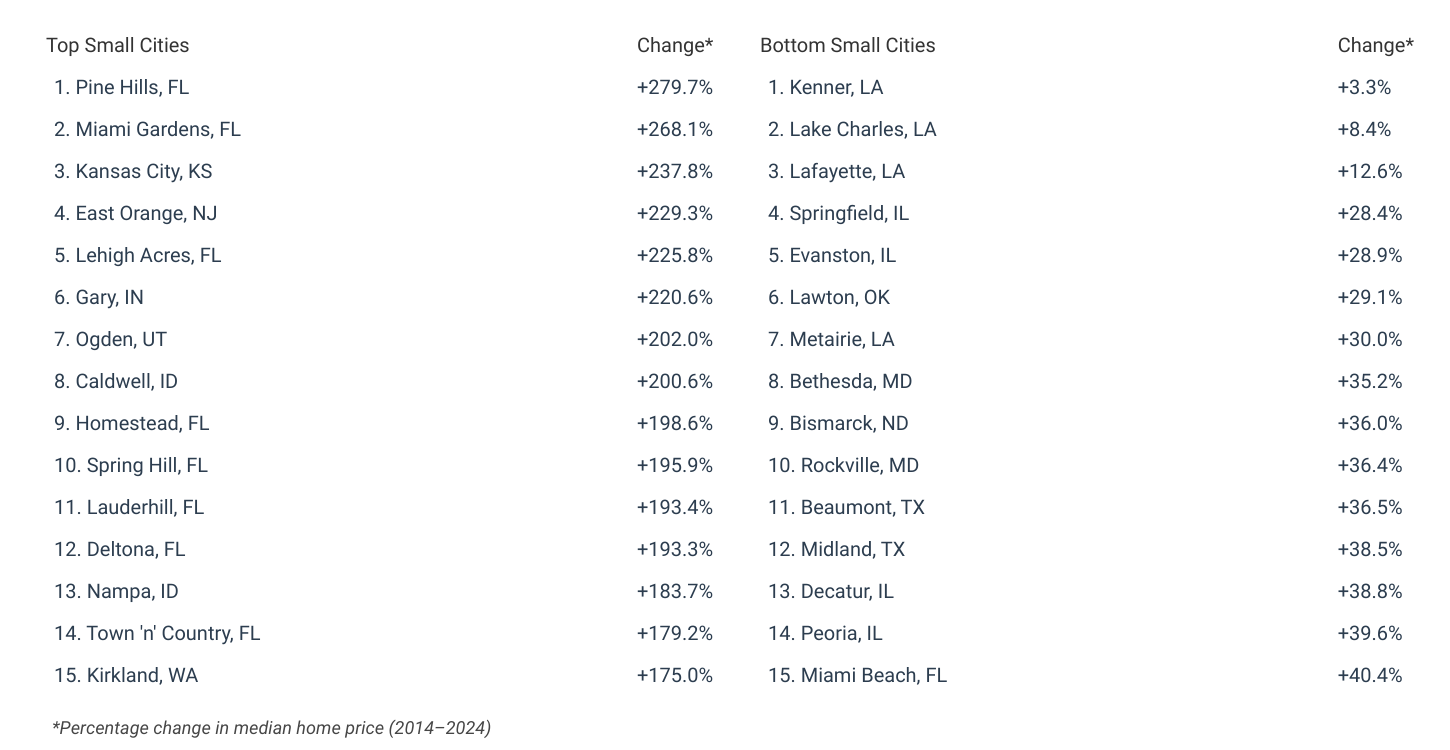
At the city level, locations in Florida notably stand out for their remarkable surge in home prices. For instance, in Pine Hills, FL, median home prices skyrocketed from approximately $74,000 in 2014 to over $281,000 today, marking a 280% increase. Seven Florida cities reported price increases of over 190%—roughly twice the national average—over the past decade.
Below is a breakdown of 10-year home price growth across America’s major cities and all 50 states. The analysis was conducted by Construction Coverage, a website that compares construction software and insurance, using data from Zillow. For complete results, refer to the original post on Construction Coverage: Cities With the Largest Increase in Home Prices Over the Last Decade.
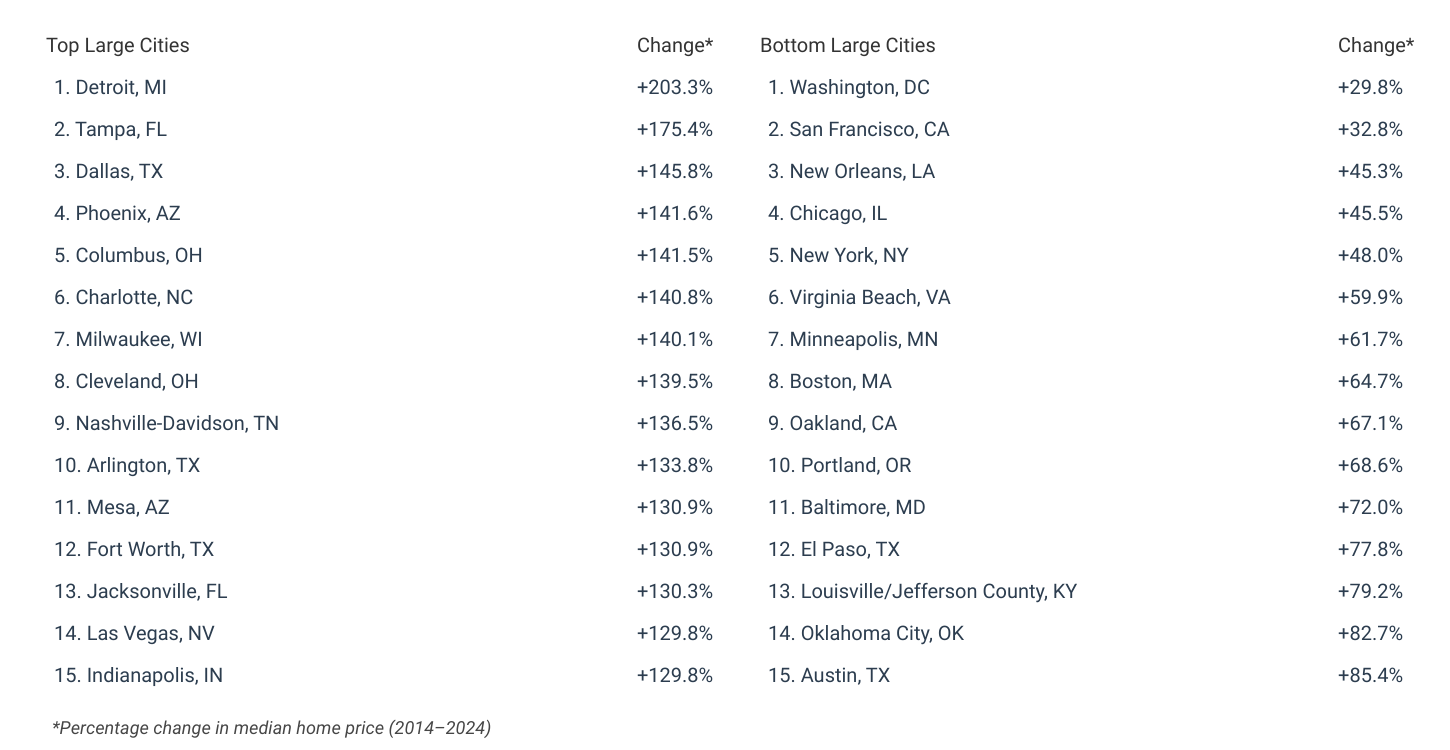
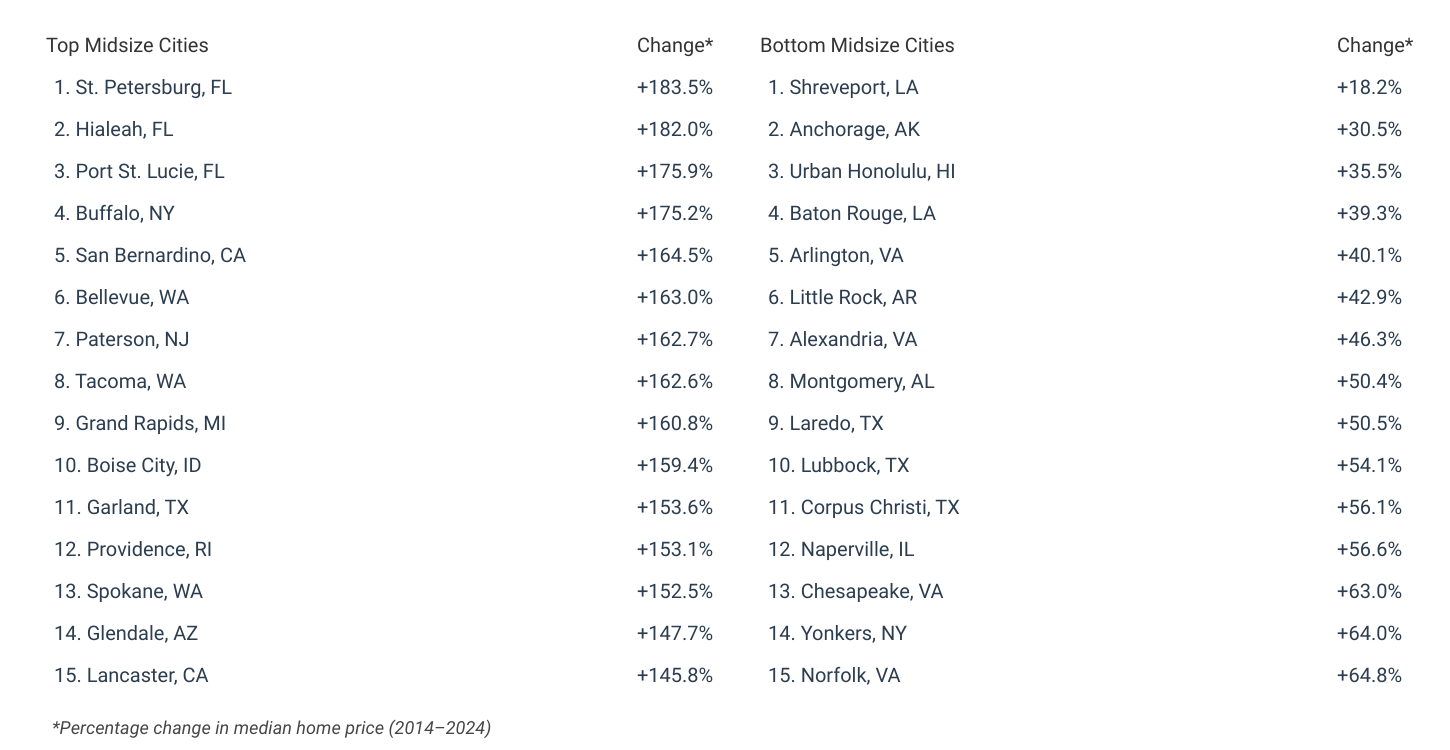
Cities With the Biggest 10-Year Increase in Home Price
States With the Biggest 10-Year Increase in Home Price
Methodology
Photo Credit: Imagenet / Shutterstock
The data used in the study comes from Zillow and the U.S. Census Bureau’s American Community Survey. To find the cities with the largest increase in home prices over the last decade, researchers at Construction Coverage compared each location’s median home value in 2014 and 2024. Locations were then ordered by their respective percentage change in median home price over those 10 years, and in the event of a tie, the location with the larger total change in home price over the last decade was ranked higher.
For relevance, only cities with complete data were included, and cities were broken into three cohorts based on population:
- Large: Cities with more than 350,000 people
- Midsize: Cities with 150,000–350,000 people
- Small: Cities with less than 150,000 people
For complete results, see Cities With the Largest Increase in Home Prices Over the Last Decade on Construction Coverage.