Technological advances have long transformed the way people work, but the current pace of change appears unprecedented. From the advent of personal computers in the 1970s to the introduction of the World Wide Web in the 1990s, followed by the emergence of smartphones, social media, and cloud computing in the 2000s, recent decades have seen significant shifts in how we work. And now, in the 2020s, the latest transformational force appears to be artificial intelligence (AI).
The field of AI research dates to the 1950s but has blossomed in recent years. Machine learning algorithms are now integrated into various products and services, including product recommendations, fraud detection, and self-driving vehicles. Recently, the development of generative AI products like OpenAI’s ChatGPT and Google’s Gemini has enabled users to interact with sophisticated chatbots and generate text or images based on prompts. For many, these innovations have shifted AI from a science fiction concept to a practical tool for work and creative pursuits.
Global Growth in Artificial Intelligence
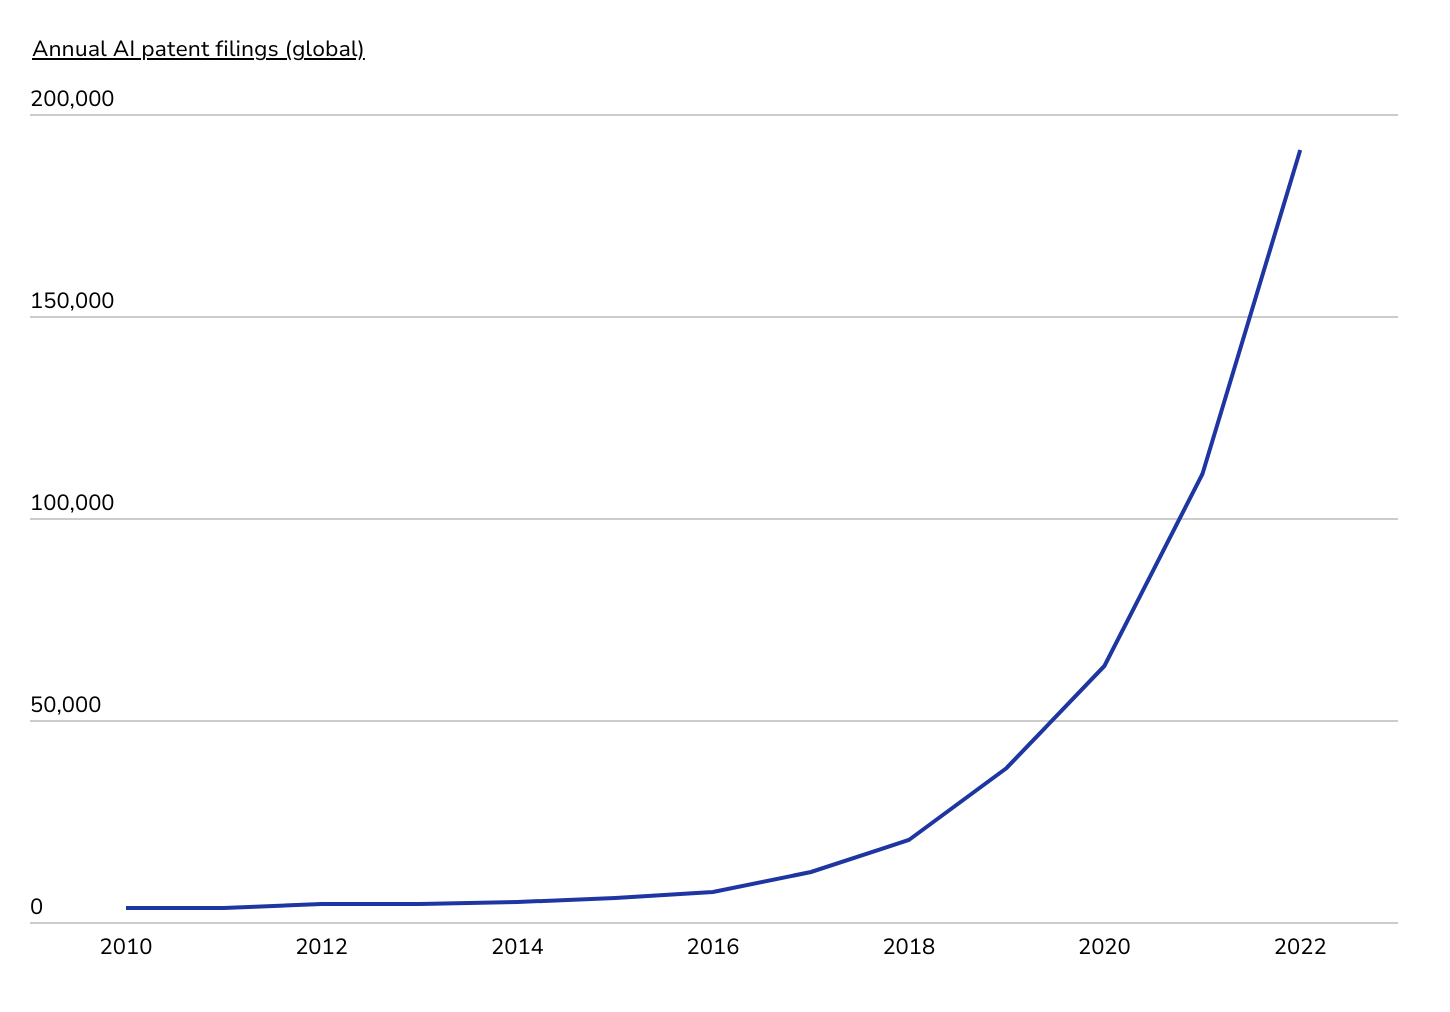
The number of AI patent filings has increased exponentially in recent years
Source: (un)Common Logic analysis of Center for Security and Emerging Technology data | Image Credit: (un)Common Logic
Beyond the well-known products and media attention, progress in AI is further demonstrated by the surge in research and development. According to Stanford University’s 2024 Artificial Intelligence Index Report, AI-related patent filings have increased exponentially, from approximately 3,500 in 2010 to over 190,000 in 2022. Similarly, the total number of AI publications nearly tripled over the same period, rising from around 88,000 in 2010 to more than 240,000 by 2022.
This extensive research has led to rapid improvements in AI performance across various competencies. For example, the most advanced AI systems now outperform humans in image, language, handwriting, and speech recognition, as well as language understanding and reading comprehension. As of last year, these models nearly matched human performance on predictive reasoning tests, heightening concerns about the potential impact of AI on the workforce.
AI Exposure & Automation Risk by Occupation
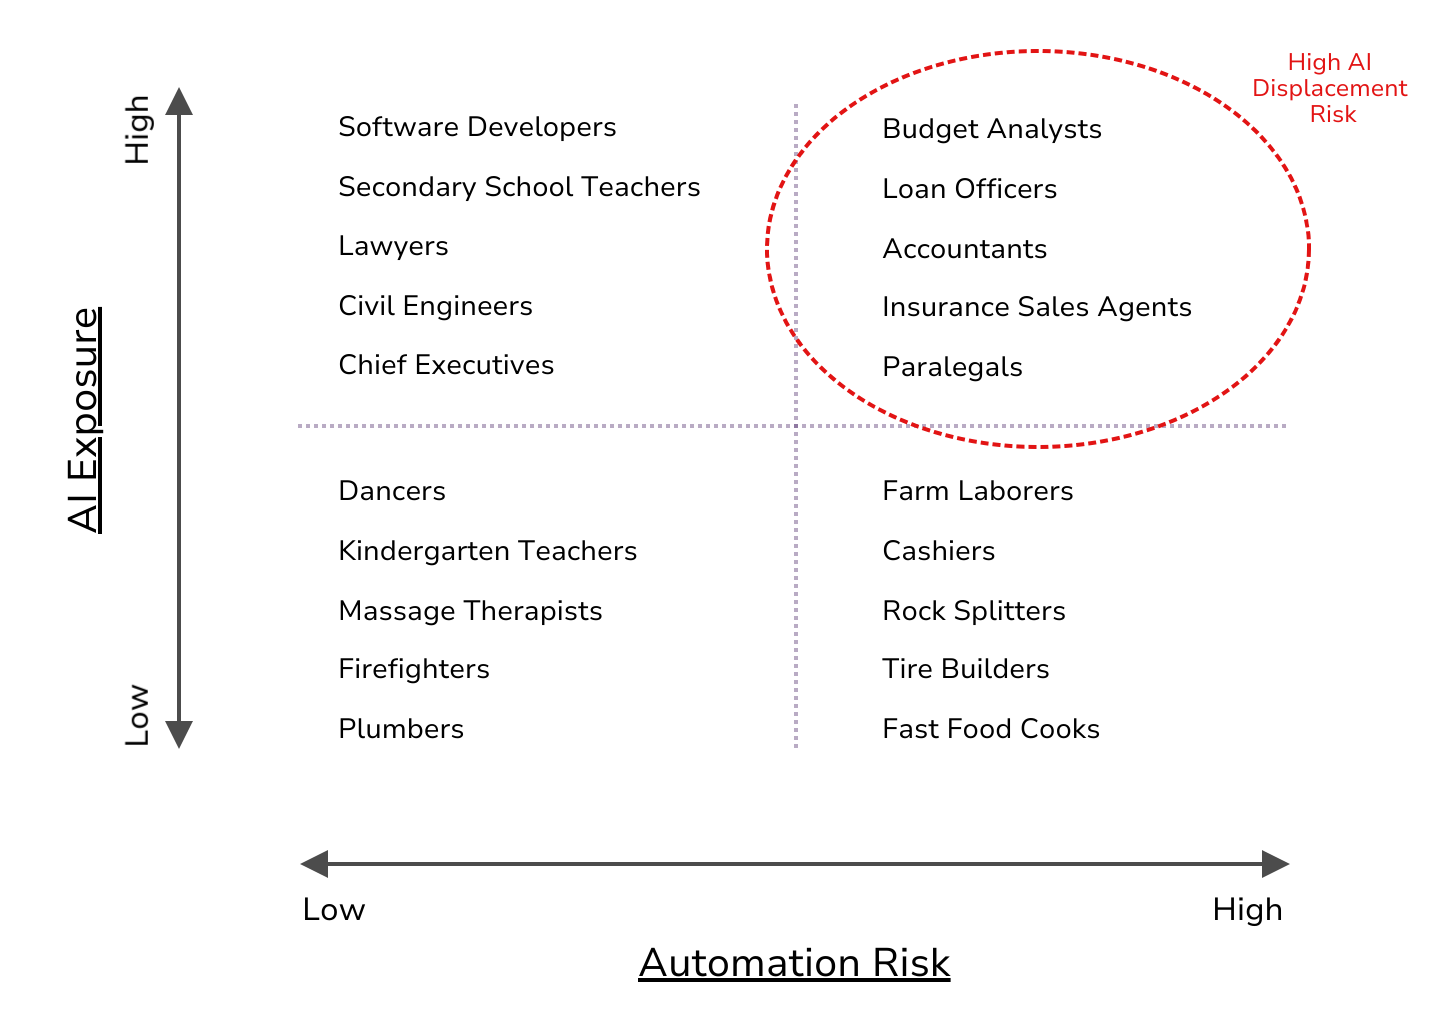
Nearly 9% of workers have high AI exposure & high automation risk
Source: (un)Common Logic analysis of Felten et al. (2021), Frey & Osborne (2013) data | Image Credit: (un)Common Logic
With the proliferation of AI-related research and new AI-enabled technologies, computers now have the potential to disrupt many industries and occupations previously believed to be insulated from automation. Historically, jobs at the highest risk of computerized automation involved repetitive, low-complexity tasks, such as those performed by assembly line workers or farm laborers. However, the range of workers at risk of job displacement has now broadened.
One useful way to understand AI’s impact on the labor force is to classify occupations based on their degree of AI exposure—how integral AI is predicted to be in their field—and the probability of computerized automation. For instance, professions like lawyers, CEOs, and civil engineers might rely on AI to enhance decision-making but face low probabilities of being completely automated. These high-AI-exposure, low-automation-risk professions make up an estimated 16% of the U.S. workforce.
Conversely, occupations with both high AI exposure and high risk of automation include loan officers, accountants, and paralegals, whose tasks and knowledge can be more easily learned and replicated by AI systems. These roles account for an estimated 9% of all workers nationally.
The majority of occupations, about 75% of total employment, are unlikely to be significantly impacted by AI but may face other types of automation risks. Jobs such as farm laborers or fast food cooks can be automated using non-AI-based computerized machines. Workers who face both low AI exposure and low risk of automation include highly hands-on professionals like dancers, firefighters, and plumbers.
AI Job Displacement by Location
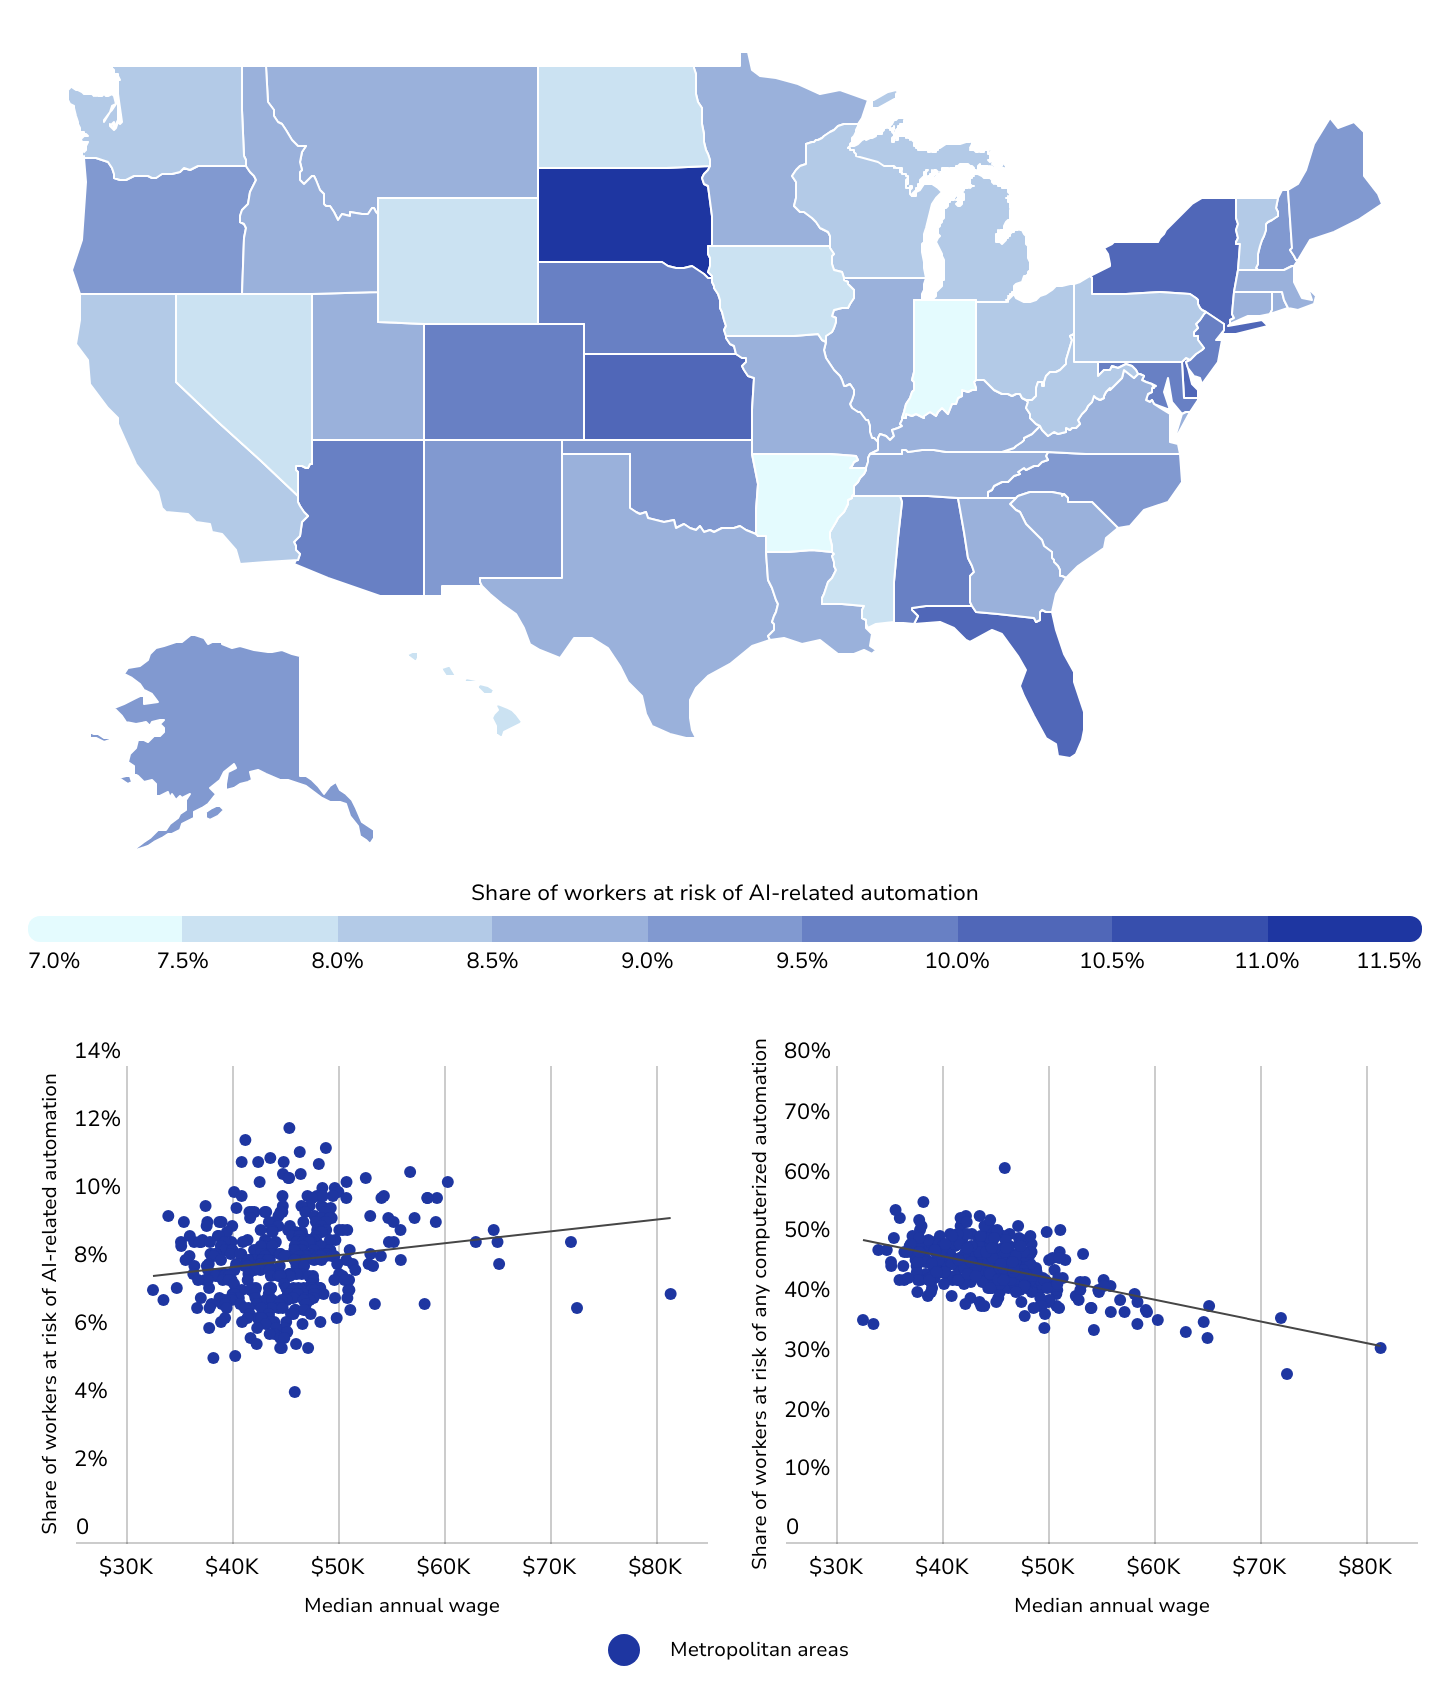
Compared to other types of automation, AI will have a greater impact on high-income workers
Source: (un)Common Logic analysis of Felten et al. (2021), Frey & Osborne (2013), Bureau of Labor Statistics data | Image Credit: (un)Common Logic
The trend toward computerized automation has historically made lower-income jobs more vulnerable to displacement, but AI changes that dynamic. AI-related automation shows a loose positive correlation with income, suggesting that higher earners may now face greater risk.
Due to the distribution of industries and jobs across the country, AI-driven job displacement is likely to impact some areas more than others. In five states—South Dakota, Kansas, Delaware, Florida, and New York—more than one in ten workers are vulnerable to AI-related automation, facing both high levels of AI exposure and high probabilities of automation. These states have high concentrations of workers in the knowledge sector. Conversely, states like Indiana, Arkansas, and Nevada, where the workforce is more concentrated in agriculture, manufacturing, or service professions, face a lower risk of AI-driven automation. However, general automation could still impact up to half of the workforce in these areas.
Among major metropolitan areas with populations of one million or more, locations in Florida and New York account for four of the top five regions at greatest risk of AI job displacement. These include Tampa, Miami, Jacksonville, and Buffalo, which have higher concentrations of workers in sectors susceptible to AI automation. In contrast, the two major metros facing the lowest risk of AI-related job loss are both in California: Riverside and San Jose.
This analysis was conducted by (un)Common Logic, a data-driven digital marketing agency, using data from the U.S. Bureau of Labor Statistics and other sources. For a detailed breakdown of AI-related job displacement risks for 389 metropolitan statistical areas and all 50 states, refer to Cities With the Most Workers at Risk of AI Job Displacement on (un)Common Logic.
Methodology
Photo Credit: Siro46 / Shutterstock
Data sources include the U.S. Bureau of Labor Statistics’ Occupational Employment and Wage Statistics (2023), Frey and Osborne’s Probability of Computerization by Occupation (2013), and Felten et al.’s AI Occupational Exposure (2021). To determine the locations with the most workers at risk of AI-related job displacement, researchers calculated the percentage of workers in occupations that have both high AI exposure and high probabilities of computerization. For the purpose of this analysis, high AI exposure was defined as being at least one standard deviation above the mean and high probability of computerization was defined as being 70% or more. Researchers also calculated the percentage of workers at risk of any computerized automation, which is simply the share of workers in occupations with high probabilities of computerization, regardless of their AI exposure. To improve comparisons across locations, metropolitan areas were grouped into cohorts based on population: small (less than 350,000), midsize (350,000–999,999), and large (1,000,000 or more).
For complete results, see Cities With the Most Workers at Risk of AI Job Displacement on (un)Common Logic.
