High grocery prices have been a defining economic story in recent years, driven by a combination of factors including pandemic-related supply chain breakdowns and labor shortages. However, an increasingly critical driver of food price inflation has been the impact of natural disasters—such as droughts, floods, and hurricanes—on the nation’s agricultural output.
In April 2025, a devastating weather system massively flooded corn, rice, soybean, and wheat crops in eastern Arkansas, affecting 31% of agricultural acreage in the region and inflicting an estimated $99 million worth of damage. Similarly, the agricultural industry in North Carolina was hit hard by Hurricane Helene in late September 2024, prompting the U.S. Department of Agriculture (USDA) to grant $221.2 million in federal disaster assistance block grants to help the industry rebuild in the state.
The increased frequency of natural hazards has created a challenging environment for farmers. However, the effects of climate- and weather-related disasters are not uniform, varying greatly depending on location. To pinpoint where these events are having the greatest impact on farmers and the nation’s food supply, researchers at Trace One—a company specializing in product lifecycle management (PLM) and regulatory compliance software for the food and beverage industry—conducted an in-depth analysis of the latest data from the U.S. Department of Agriculture (USDA) and the Federal Emergency Management Agency (FEMA). Here’s what they found.
- According to the USDA, there are 1.9 million farms in the U.S. that are responsible for producing $503 billion in crop and livestock value annually.
- FEMA estimates that the U.S. loses approximately $3.5 billion in agricultural value each year due to natural hazards—primarily drought—or more than $1,800 per farm.
- California, which produces 12% of the nation’s total agricultural value, disproportionately bears 37% of the total losses caused by natural hazards, amounting to $1.3 billion annually.
- Santa Barbara County in California has an expected annual loss of over $245 million, the most of any county in the U.S., which equates to more than $180,000 lost per farm each year.
- All but one of the top 15 counties with the greatest expected annual losses are located in California.
Annual Agriculture Loss Due to Natural Hazards
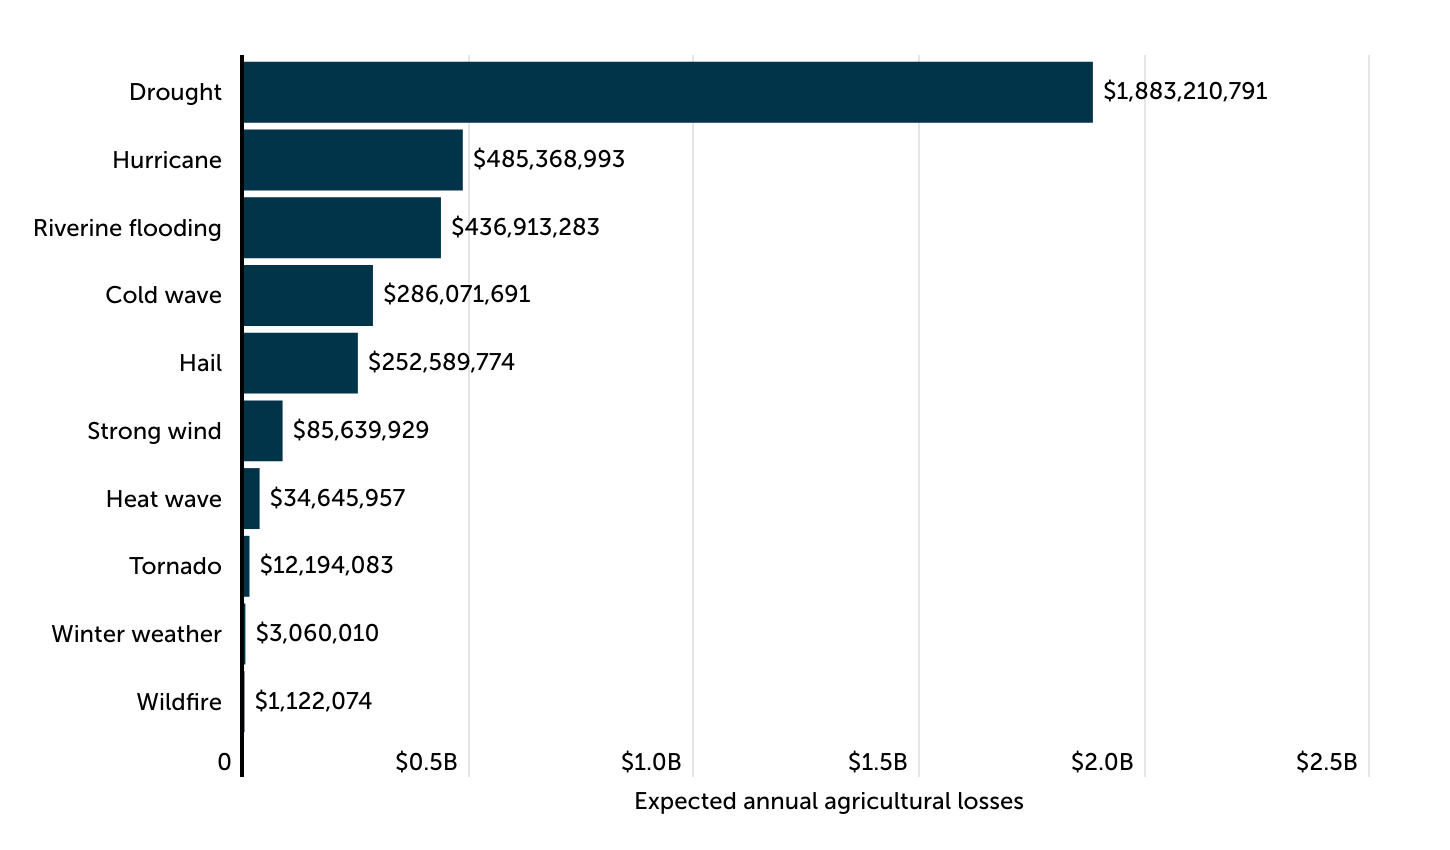
Drought is the most common cause of economic loss in the agriculture industry

Source: Trace One analysis of FEMA data | Image Credit: Trace One
According to estimates from FEMA, natural hazards cause an average of $3.5 billion in agricultural losses annually, with drought being the single largest contributor. Drought alone accounts for more than half of these losses, averaging $1.9 billion per year. The financial impact of drought underscores its threat to farmers, particularly in regions reliant on water-intensive crops.
Other significant contributors to agricultural losses include hurricanes, which cause $485 million in annual losses, along with flooding ($437 million) and cold waves ($286 million). Events such as hailstorms, strong winds, and heat waves collectively add hundreds of millions in losses to the yearly toll. While less frequent, disasters like tornadoes, winter weather, and wildfires also contribute economic strain in certain regions.
Expected Annual Losses by Region
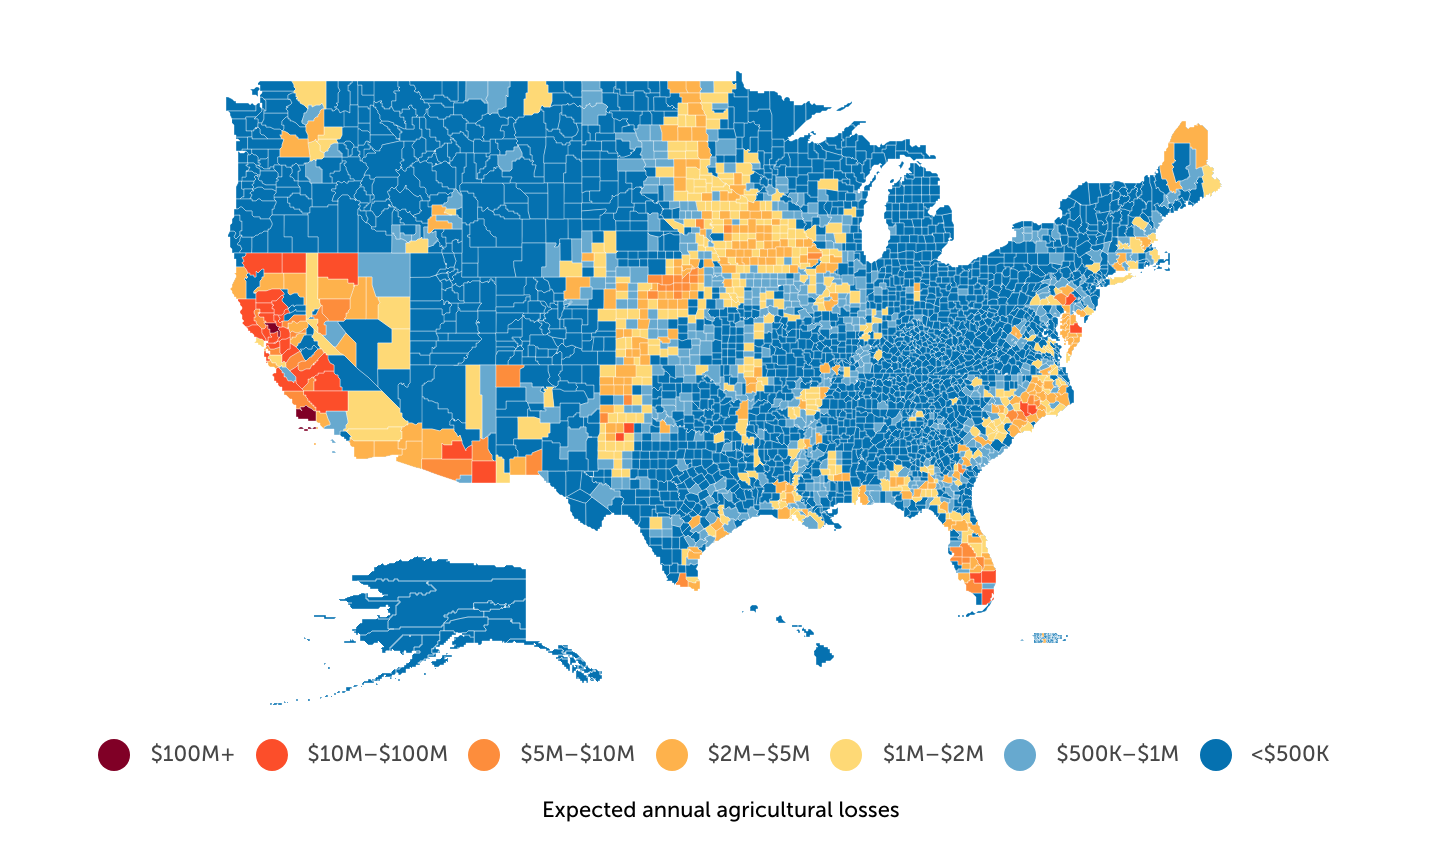
California farms are facing the largest losses due to natural hazards

Source: Trace One analysis of FEMA data | Image Credit: Trace One
Natural disasters impacting agriculture vary significantly across U.S. regions due to differing climates and geographic vulnerabilities. Drought is a persistent challenge on the West Coast, particularly in California, as well as the Southwest and parts of the Southern Plains, where water scarcity hampers crop yields and livestock production. Hurricanes have the most severe impact in the Southeast and Mid-Atlantic regions, where states like Florida and North Carolina frequently experience storm surges and high winds that devastate crops and infrastructure. Riverine flooding is most problematic in the Mississippi River Basin and its extensive tributary networks, as well as in the Pacific Northwest. Cold waves are most prominent in the Midwest and Mountain West, where freezing temperatures can damage crops and livestock operations.
Taken together, California leads the nation in agricultural losses due to natural hazards, with farms in the state incurring an estimated $1.3 billion in losses annually. This figure dwarfs losses in other states, with drought being the most significant hazard affecting California’s vast agricultural sector. On a per-farm basis, California reports an average loss of $20,528—the highest of any state—reflecting its reliance on high-value crops such as fruits, nuts, and vegetables, which are particularly vulnerable to water shortages.
By comparison, Texas, which ranks second, faces an expected annual loss of $205 million, with droughts again being the primary driver. Iowa, North Carolina, and Florida round out the top five, each suffering from a combination of droughts and hurricanes, though with lower total and per-farm losses than California.
At the county level, California continues to dominate the rankings, with Santa Barbara County reporting the largest expected losses at $245 million annually. Drought is the principal hazard here, impacting high-value crops like strawberries, vegetables, and wine grapes. Other California counties, such as Yolo, Napa, Sutter, and Colusa, also rank highly, with annual losses ranging from $70 million to $115 million. These counties experience some of the highest loss rates per farm, with those in Santa Barbara County and Yolo County losing an estimated $180,339 and $144,645 each year, respectively.
For complete results, see the original post: Where Natural Disasters Are Having the Biggest Impact on the Nation’s Food Supply on Trace One.
Methodology

Photo Credit: Encierro / Shutterstock
The data used in this study is from FEMA’s National Risk Index and the USDA’s Census of Agriculture. To identify locations where natural hazards have the greatest impact on the nation’s food supply, researchers at Trace One analyzed and ranked locations based on their average annual economic loss (expected annual loss) in 2025 dollars within the agricultural sector. This metric accounts for damages caused by natural hazards such as cold waves, hail, heat waves, hurricanes, riverine flooding, strong winds, tornadoes, wildfires, and winter weather events, using data collected since 1996. Total farm data was derived using 2022 county data and 2024 state data, the latest available data provided from the USDA. In the event of a tie, locations with greater expected annual losses per farm were ranked higher. The analysis also incorporated the expected annual loss rate, calculated as the expected annual loss divided by the total annual value of the agricultural sector for each location. Additionally, researchers identified the worst natural hazard for agriculture in each location, which is the hazard contributing the largest share of the expected annual loss.
For complete results, see Where Natural Disasters Are Having the Biggest Impact on the Nation’s Food Supply on Trace One.
