
For decades, the Supplemental Nutrition Assistance Program (SNAP) has been one of the most significant social welfare programs in the United States, helping millions of Americans afford basic nutrition. As a federally funded program, SNAP has been a focal point of debate for both major political parties, often framed as either a critical tool in reducing poverty and food insecurity or a costly government expense in need of reform. Unlike many partisan issues, however, changes to SNAP have not always followed clear party lines. Both Republican and Democratic administrations have expanded and contracted the program at different times, reflecting a complex balance between fiscal and social responsibility.
In the 1980s, the Reagan administration implemented cuts to food assistance programs as part of broader efforts to reduce federal spending, while the Clinton administration in the 1990s enacted welfare reform that imposed stricter work requirements for SNAP recipients. On the other hand, the George W. Bush administration expanded access to SNAP, and during the Great Recession, the Obama administration significantly increased benefits. More recently, the current Trump administration and Republican lawmakers have signaled their intent to scale back SNAP benefits, arguing for stronger work requirements, limits on the purchase of certain foods, and budget reductions.
Amid this evolving policy landscape, Trace One—a company specializing in regulatory compliance for the food and beverage industry—examined the latest data from the USDA and Census Bureau to understand how SNAP is currently utilized across the country. How many Americans depend on food assistance today, and what does the program cost? What are the demographic characteristics of SNAP recipients, and which states rely most heavily on SNAP benefits? By analyzing recent SNAP participation rates, benefit distribution, and economic factors, this report provides a data-driven look at the role of food assistance in different parts of the country.
How Many Americans Benefit from SNAP?
Source: Trace One analysis of USDA data
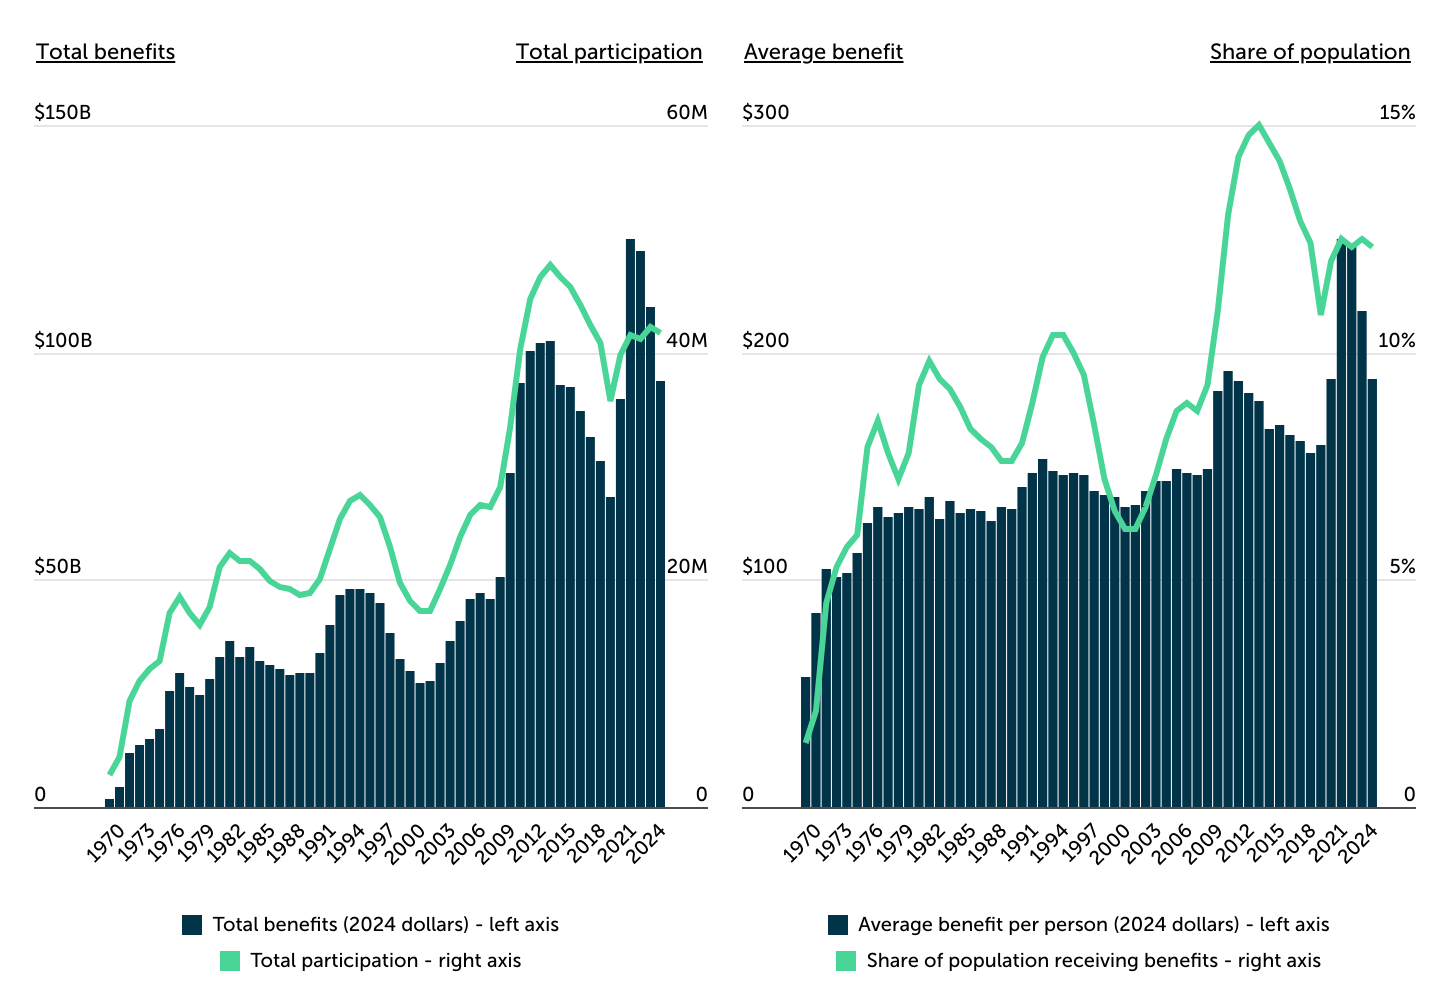
Since the passage of the Food Stamp Act in 1964, SNAP has expanded significantly, becoming one of the largest federal assistance programs in the U.S. Historically, SNAP participation has fluctuated in response to economic conditions, increasing during periods of recession and declining during periods of expansion. When unemployment and poverty rates rise, more Americans turn to food assistance programs, while a strong economy tends to reduce reliance on SNAP.
The Great Recession marked one of the most significant expansions of SNAP in its history. As unemployment and poverty surged after the 2008 financial crisis, the number of recipients climbed from 28.2 million in 2008 to over 40 million in 2010, peaking at 47.6 million in 2013. Total program spending more than doubled (adjusted for inflation), surpassing $100 billion annually in 2024 dollars during this period. While participation declined in the years that followed, the COVID-19 pandemic triggered another surge, pushing SNAP enrollment from 35.7 million in 2019 to 41.6 million by 2021 and total spending to a record $125 billion.
As of fiscal year 2024, 41.7 million Americans, or 12.3% of the U.S. population, receive SNAP benefits monthly. The program’s total cost stands at $93.8 billion annually, a decline from its pandemic-era peak but still historically high. The average monthly SNAP benefit received is $188 per participant or $352 per participating household.
Demographic Characteristics of SNAP Recipients
Source: Trace One analysis of U.S. Census Bureau data
Eligibility for SNAP is primarily based on income and household size, with federal guidelines setting limits on earnings and financial assets. Households typically must have a gross income at or below 130% of the federal poverty line, though certain groups may qualify under different criteria. While able-bodied working-age adults generally must meet work requirements to remain eligible, the program serves a broad and diverse population, including children, seniors, veterans, individuals with disabilities, and low-income workers.
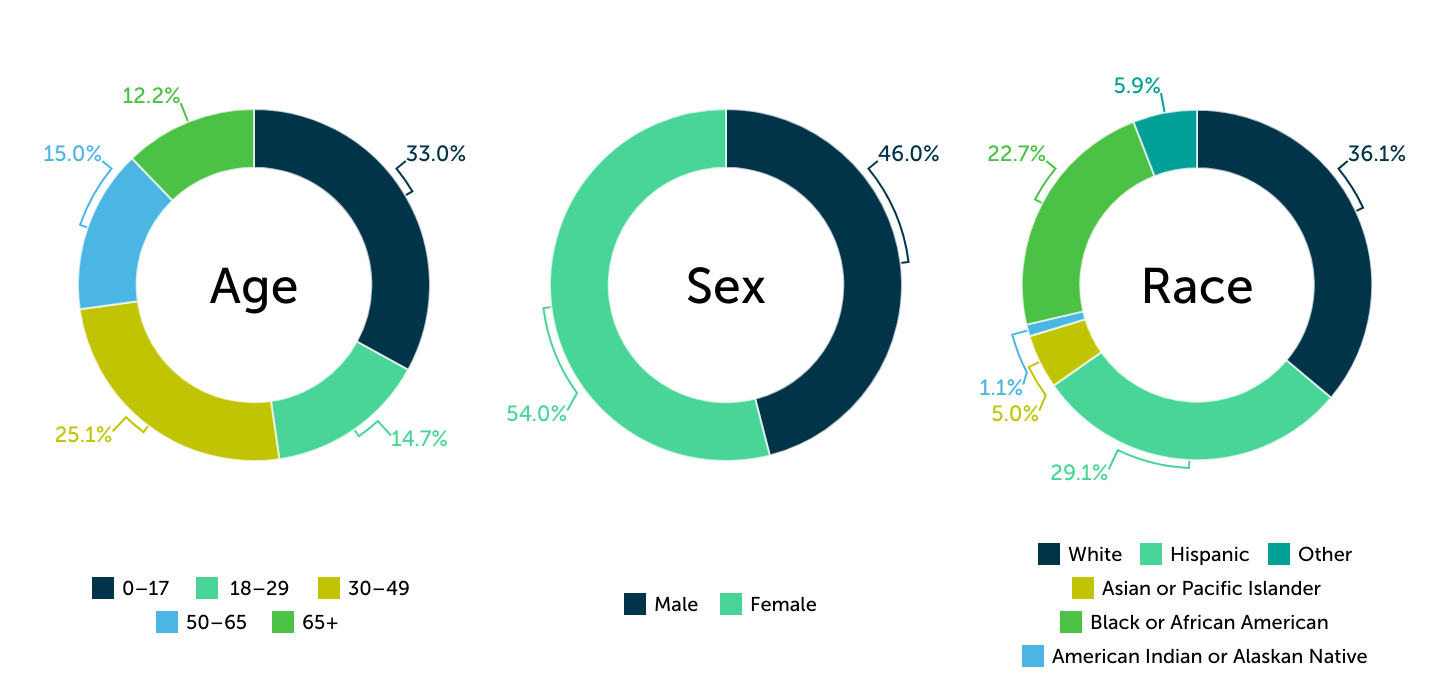
Children make up the largest share of SNAP recipients, with 33% of participants under the age of 18. Adults between the ages of 30 and 49 account for 25.1%, while those aged 18 to 29 make up 14.7%. Older adults comprise a smaller share of the SNAP program, with 15% of recipients between 50 and 65 years old and 12.2% aged 65 or older.
Women represent a slight majority of SNAP recipients, accounting for 54%, compared to 46% who are men. Women are more likely to be in poverty than men and also more likely to have children in their household, increasing the likelihood of SNAP eligibility. Racial and ethnic diversity among recipients is also notable. Non-Hispanic White individuals, who make up approximately 57% of the U.S. population, account for 36.1% of SNAP recipients. Black or African American (non-Hispanic) individuals represent 22.7% of participants, a share nearly twice their proportion of the general population. Hispanic individuals, who make up 19.4% of the population, account for a higher 29.1% of SNAP recipients. In contrast, Asian or Pacific Islanders (non-Hispanic) comprise 5% of SNAP recipients, a rate slightly below their overall population share.
SNAP Participation by State
Source: Trace One analysis of USDA and Census data
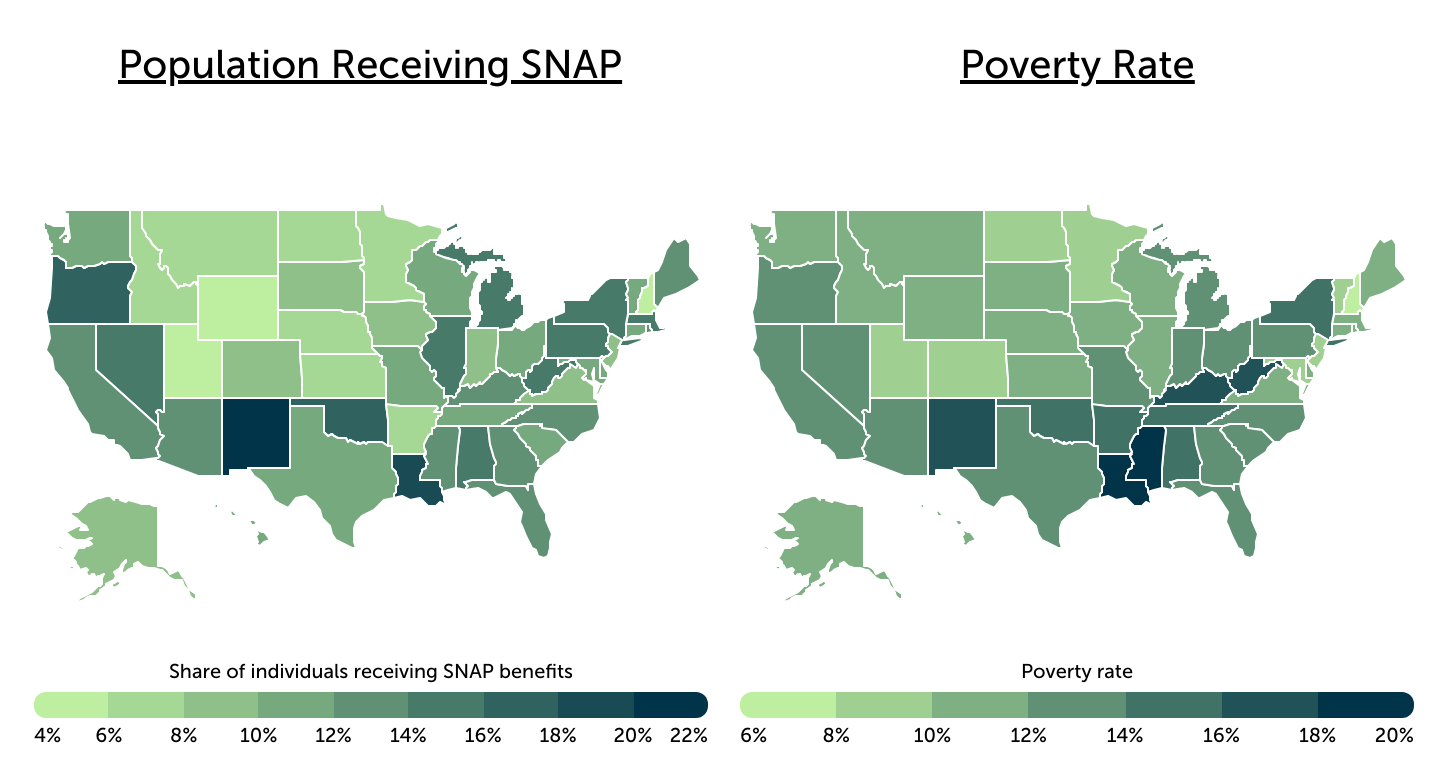
SNAP participation rates vary significantly across the United States, reflecting differences in poverty levels, economic conditions, and state-level eligibility policies. While states with higher poverty rates generally have higher shares of residents receiving food assistance, the correlation is not perfect, as states have some latitude in setting stricter or more lenient eligibility requirements.
The South has some of the highest SNAP participation rates. Louisiana, which has the highest poverty rate in the country (18.9%), also has one of the highest SNAP participation rates, with 18.5% of residents receiving benefits. Similarly, Oklahoma (16.9% SNAP participation), West Virginia (15.7%), and Alabama (14.7%) all have above-average SNAP participation and poverty levels. However, not all high-poverty Southern states report high SNAP enrollment. For instance, Arkansas, despite having the seventh-highest poverty rate, has one of the lowest SNAP participation rates (7.8%), in part due to stricter eligibility requirements.
In the West, SNAP participation is more varied. New Mexico has the highest share of residents receiving food assistance in the country at 21.3%—in line with its 17.8% poverty rate. Other Western states with relatively high SNAP participation include Oregon (17.9%) and Nevada (15.8%), despite both having below-average poverty rates. Meanwhile, Utah (5.0%) and Wyoming (5.0%) have some of the lowest participation rates in the country.
In the Northeast, SNAP participation often exceeds what poverty levels alone would predict. Massachusetts (15.9% SNAP participation), Pennsylvania (15.4%), and Rhode Island (13.2%) all have relatively low poverty rates—ranging from 10.4% to 12.0%—but higher-than-average SNAP enrollment. This trend is driven by more inclusive eligibility policies and strong outreach efforts. New York’s 15.0% SNAP participation rate, on the other hand, closely aligns with its 14.2% poverty rate.
The Midwest generally sees lower SNAP participation, accounting for four of the 10 states with the lowest enrollment. North Dakota (6.2%), Kansas (6.4%), Nebraska (7.8%), and Minnesota (7.9%) all report participation rates below 8%. However, Illinois stands out as an exception, with 15.4% of residents receiving benefits—well above the national average—despite its below-average poverty rate of 11.6%. Similar to other states with higher-than-expected SNAP participation, Illinois has expanded eligibility beyond federal requirements.
While SNAP participation broadly tracks poverty levels, state policies play a crucial role in shaping enrollment. More inclusive eligibility rules and outreach efforts can increase access, while stricter policies may limit participation even in high-need areas. For a complete breakdown of SNAP participation in all 50 U.S. states, see the full report: Feeding America: Which States Depend Most on Food Assistance? on Trace One.
Methodology

Photo Credit: Zamrznuti Tonovi / Shutterstock
This analysis examines food assistance dependence across U.S. states by evaluating Supplemental Nutrition Assistance Program (SNAP) participation and benefits. Data sources include the U.S. Department of Agriculture (USDA) Food and Nutrition Service (FNS) SNAP Data Tables, the U.S. Census Bureau American Community Survey (ACS) 1-Year Estimates, the U.S. Census Bureau Families and Living Arrangements, and the U.S. Bureau of Economic Analysis Personal Income and Outlays.
To assess SNAP dependence, researchers at Trace One calculated the percentage of each state’s total population receiving SNAP benefits, as well as the percentage of households participating in the program during fiscal year 2024. These figures are based on USDA-reported average monthly participation over the course of the year. Researchers also calculated the average monthly SNAP benefit per participating individual and household, along with the total annual SNAP benefits distributed in each state during the year.
State-level economic conditions were considered by incorporating poverty rate statistics from the 2023 ACS. State-level population and household estimates are from 2023, the most recent available data, while national-level estimates were based on 2024 figures. National demographic characteristics of SNAP recipients were derived from self-reported data in the 2023 ACS.
For complete results, see Feeding America: Which States Depend Most on Food Assistance? on Trace One.