
Photo Credit: fizkes / Shutterstock
Over the last year and a half, one of the dominant stories in the U.S. economy has been the steep increase in the cost of homes in a highly competitive market. Earlier this year, the median sales price of a home in the U.S. passed $400,000 for the first time, up by more than 20% from before the COVID-19 pandemic began.
With unusually low inventory of existing homes for sale throughout the pandemic and new construction struggling to catch up, limited supply has been one of the factors driving these increases. On the demand side, millions of homebuyers have entered the market, seeking to take advantage of low mortgage rates, increased savings, and strong investment returns during the pandemic.
But one of the more fundamental factors in the demand for homes is demographics. Millennials—currently aged 25 to 40—are now the largest generation in the U.S. and in the prime age for buying a first or second home. According to a 2021 study from the National Association of Realtors, Millennials now make up 37% of homebuyers, by far the largest share of any generation.
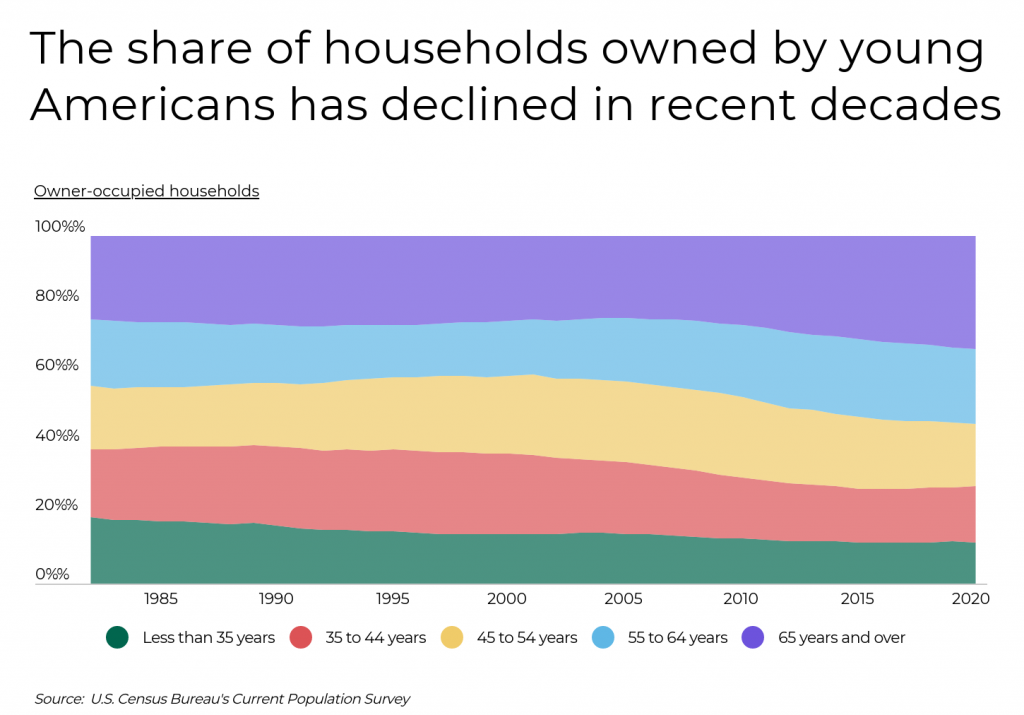
Increased homebuying among younger Americans would represent the reversal of a long-running decline. Census Bureau data shows that the share of under-35 homeowners has dropped from around 19% in the early 1980s—when many Baby Boomers were still of that age—to less than 12% today. In the 1990s, the declining share could be attributed to the smaller Generation X coming of age, while more recently, Millennials were forced to delay homebuying as they suffered the economic consequences of entering the workforce in the post-recession era. Growing debt burdens among younger Americans, primarily from student loans, have also been a barrier to young people saving for a home and obtaining a mortgage.
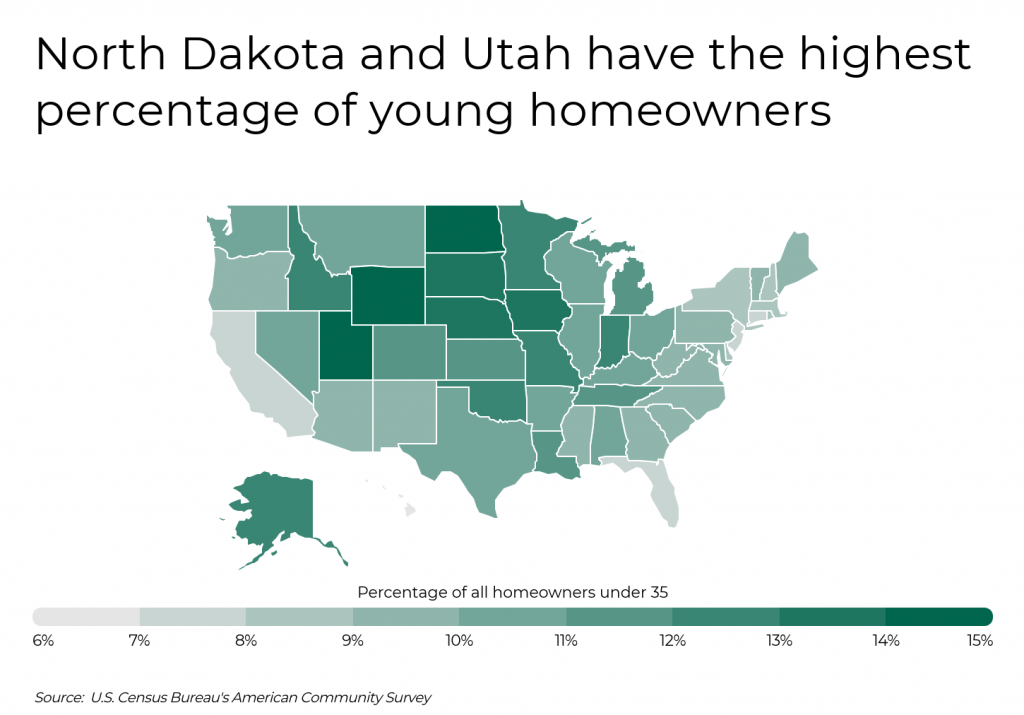
Recent financial pressures on young Americans also help to explain where homeownership is more common among people under 35. Areas where the costs of housing are highest, like Hawaii, California, and the Northeast, have the lowest share of young homeowners, with rates below the national average of 9.9%. In contrast, locations in the Midwest and Mountain West tend to have higher rates of homeownership among young people. States like North Dakota (15.5%) and Utah (15.2%) offer a combination of more affordable home prices and strong economies that put homeownership in reach for young families. The same is true at the local level.
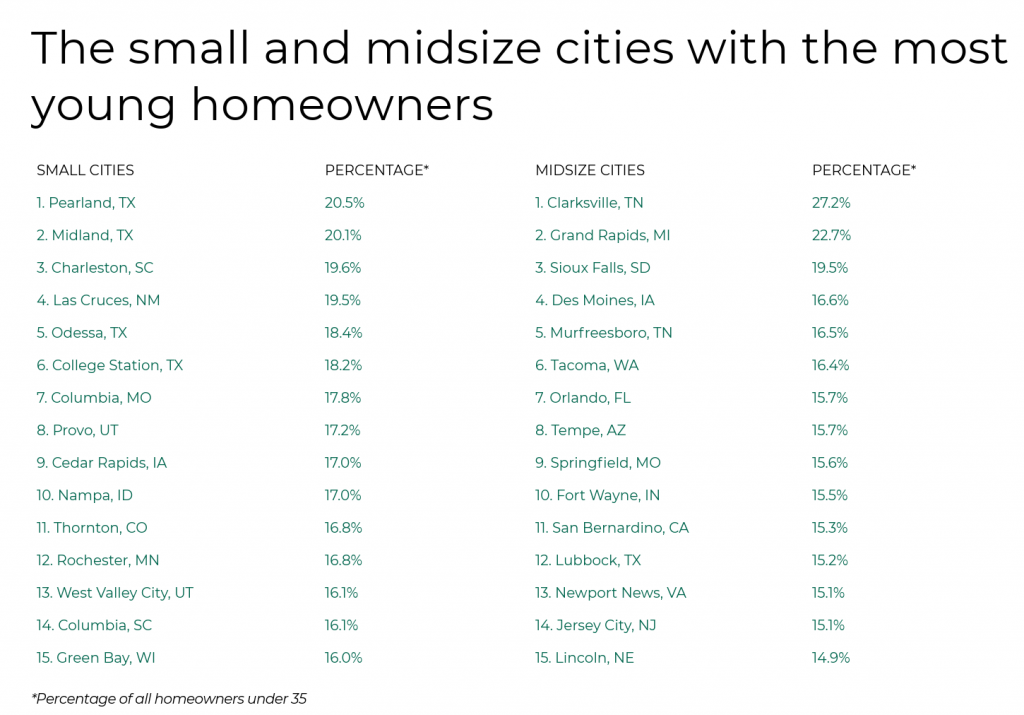
The data used in this analysis is from the U.S. Census Bureau’s 2019 American Community Survey. To determine the locations with the most young homeowners, researchers at Filterbuy calculated the percentage of all owner-occupied households headed by someone under 35 years old. In the event of a tie, the location with the greater total number of owner-occupied households headed by someone under 35 was ranked higher.
Here are the cities with the most young homeowners.
Large Cities With the Most Young Homeowners
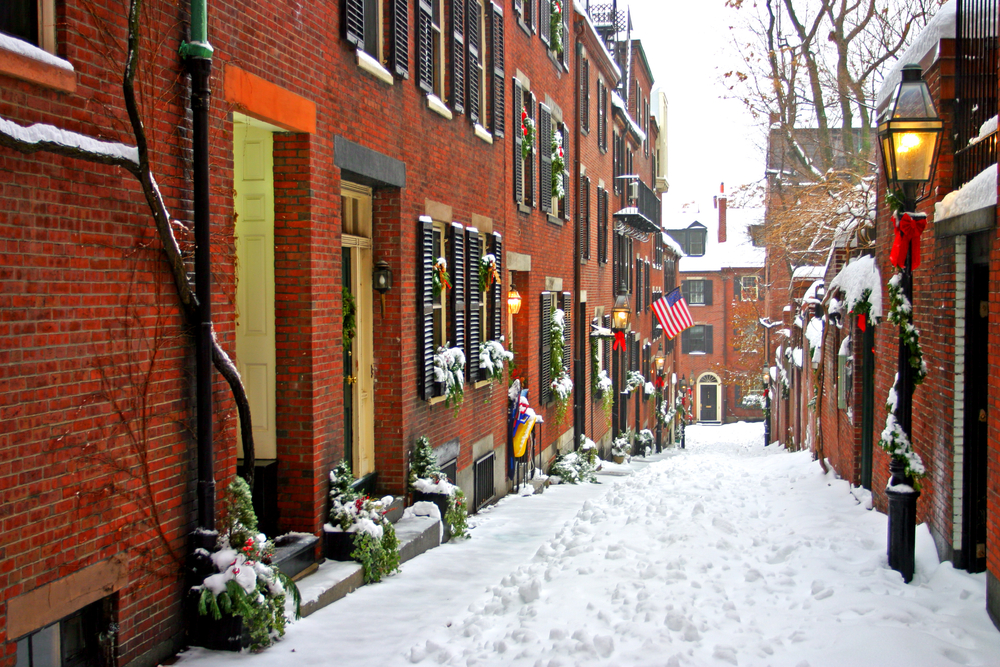
Photo Credit: CO Leong / Shutterstock
15. Boston, MA
- Percentage of all homeowners under 35: 13.7%
- Total homeowners under 35: 12,924
- Total homeowners (all ages): 94,202
- Percentage of under 35-year-olds that own: 14.6%
Photo Credit: Andrei Medvedev / Shutterstock
14. Washington, D.C.
- Percentage of all homeowners under 35: 13.9%
- Total homeowners under 35: 16,759
- Total homeowners (all ages): 120,988
- Percentage of under 35-year-olds that own: 19.1%

Photo Credit: Sean Pavone / Shutterstock
13. Oklahoma City, OK
- Percentage of all homeowners under 35: 14.2%
- Total homeowners under 35: 20,328
- Total homeowners (all ages): 143,591
- Percentage of under 35-year-olds that own: 32.1%

Photo Credit: f11photo / Shutterstock
12. Milwaukee, WI
- Percentage of all homeowners under 35: 14.5%
- Total homeowners under 35: 13,480
- Total homeowners (all ages): 92,982
- Percentage of under 35-year-olds that own: 19.5%

Photo Credit: Tupungato / Shutterstock
11. Kansas City, MO
- Percentage of all homeowners under 35: 14.7%
- Total homeowners under 35: 16,318
- Total homeowners (all ages): 110,735
- Percentage of under 35-year-olds that own: 27.8%

Photo Credit: Checubus / Shutterstock
10. Minneapolis, MN
- Percentage of all homeowners under 35: 14.9%
- Total homeowners under 35: 12,599
- Total homeowners (all ages): 84,829
- Percentage of under 35-year-olds that own: 20.3%

Photo Credit: Checubus / Shutterstock
9. Seattle, WA
- Percentage of all homeowners under 35: 15.3%
- Total homeowners under 35: 23,075
- Total homeowners (all ages): 150,887
- Percentage of under 35-year-olds that own: 18.9%
Photo Credit: zimmytws / Shutterstock
8. Raleigh, NC
- Percentage of all homeowners under 35: 15.5%
- Total homeowners under 35: 14,897
- Total homeowners (all ages): 96,410
- Percentage of under 35-year-olds that own: 28.1%

Photo Credit: Zack Frank / Shutterstock
7. Columbus, OH
- Percentage of all homeowners under 35: 15.6%
- Total homeowners under 35: 26,211
- Total homeowners (all ages): 167,715
- Percentage of under 35-year-olds that own: 22.3%
Photo Credit: Matt Gush / Shutterstock
6. Bakersfield, CA
- Percentage of all homeowners under 35: 15.7%
- Total homeowners under 35: 10,872
- Total homeowners (all ages): 69,256
- Percentage of under 35-year-olds that own: 39.8%

Photo Credit: Philip Lange / Shutterstock
5. Fort Worth, TX
- Percentage of all homeowners under 35: 15.9%
- Total homeowners under 35: 28,672
- Total homeowners (all ages): 179,783
- Percentage of under 35-year-olds that own: 37.2%
Photo Credit: Jacob Boomsma / Shutterstock
4. Aurora, CO
- Percentage of all homeowners under 35: 16.2%
- Total homeowners under 35: 13,709
- Total homeowners (all ages): 84,585
- Percentage of under 35-year-olds that own: 42.3%

Photo Credit: Mihai_Andritoiu / Shutterstock
3. Nashville-Davidson, TN
- Percentage of all homeowners under 35: 16.5%
- Total homeowners under 35: 24,640
- Total homeowners (all ages): 149,072
- Percentage of under 35-year-olds that own: 29.0%

Photo Credit: Roschetzky Photography / Shutterstock
2. Denver, CO
- Percentage of all homeowners under 35: 16.5%
- Total homeowners under 35: 26,201
- Total homeowners (all ages): 158,620
- Percentage of under 35-year-olds that own: 25.9%

Photo Credit: ESB Professional / Shutterstock
1. Atlanta, GA
- Percentage of all homeowners under 35: 17.5%
- Total homeowners under 35: 18,274
- Total homeowners (all ages): 104,332
- Percentage of under 35-year-olds that own: 24.2%
Detailed Findings & Methodology
The data used in this analysis is from the U.S. Census Bureau’s 2019 American Community Survey. To determine the locations with the most young homeowners, researchers calculated the percentage of all owner-occupied households headed by someone under 35 years old. In the event of a tie, the location with the greater total number of owner-occupied households headed by someone under 35 was ranked higher. For the purpose of this analysis, the term homeowner refers to the head (one per household) of an owner-occupied household, as designated by the Census Bureau. To improve relevance, only cities with at least 100,000 residents were included. Additionally, cities were grouped into cohorts based on population size: small (100,000–149,999), midsize (150,000–349,999), and large (3500,000 or more).