
Photo Credit: Rawpixel.com / Shutterstock
In years past, depositing a check, starting a new bank account, or taking out a loan required a visit to the local bank. But with the digital economy in full force today, many Americans have less and less need to visit a brick-and-mortar bank branch, and an increasing share of Americans are living mostly cashless. Financial transactions like transferring funds between accounts, depositing checks, and even taking out a loan can be done without setting foot in a physical bank. However, for a certain segment of the population, visiting the local bank branch can be a preference or even a necessity.
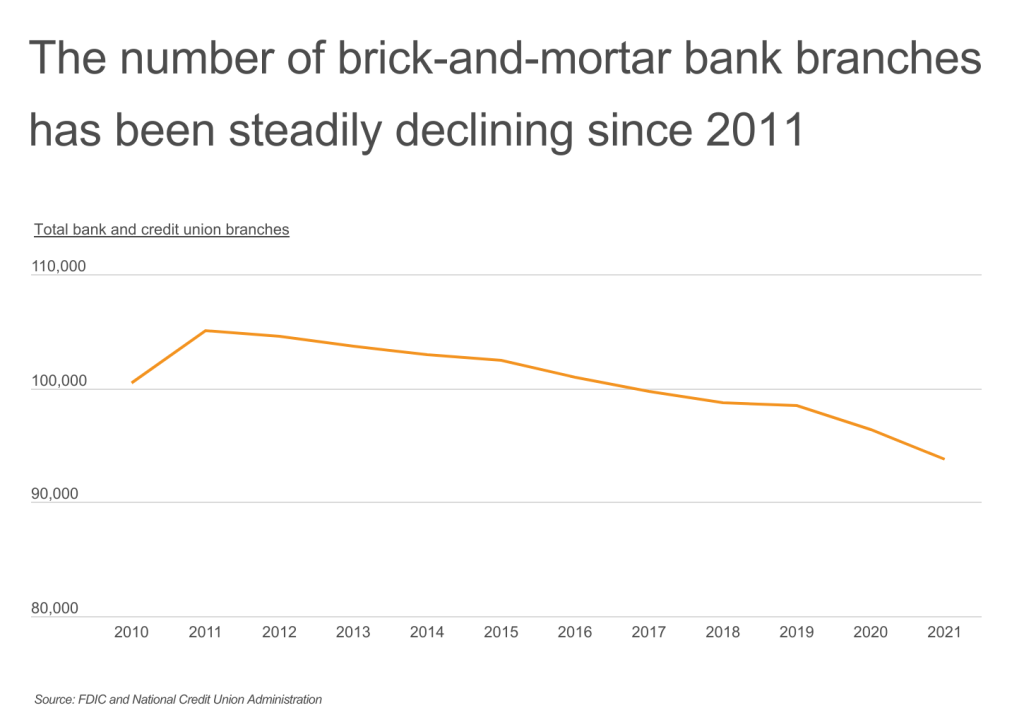
As a large share of the population shifts to online banking, banks have been closing branches and ATMs. The number of brick-and-mortar bank branches—including credit union locations—peaked in 2011 at just over 105,000 and has been steadily declining since then. In 2021, there were fewer than 94,000 brick-and-mortar bank branches nationally. Fewer branches can mean longer wait times for those who rely on the bank locations that remain open. For some, this can mean having to spend additional time away from their daily obligations such as work or childcare.
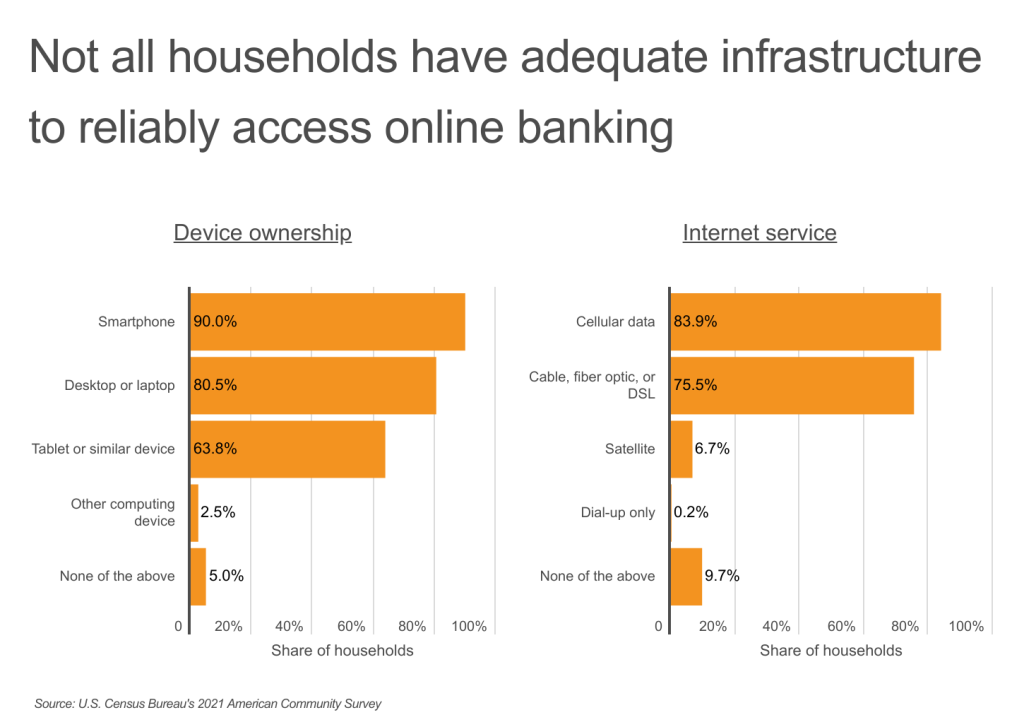
The shift to the digital economy and the rise of online banking has made it easier and more convenient for many Americans to do their banking. However, many do not have the necessary infrastructure to access online banking reliably. While the majority of households own devices to access the internet, 10% of households don’t have a smartphone, nearly 20% don’t own a desktop or laptop, and more than one-third don’t own a tablet. An even larger share of households do not have internet subscriptions—16% do not have cellular data plans, almost one-quarter don’t have broadband internet, and nearly 10% have no internet subscription at all.
These disparities in reliable access to online banking are even more pronounced after accounting for education and income. According to the U.S. Census Bureau, less educated households are much less likely to own a computer than households with a college degree—nearly 11% of households without a high school degree do not own a computer, compared to just 1% of those with a bachelor’s degree or higher. And lower-income households are much less likely to have an internet subscription. More than 26% of households with less than $20,000 in annual income do not have an internet subscription, compared to less than 4% of households who have an annual income of $75,000 or more.
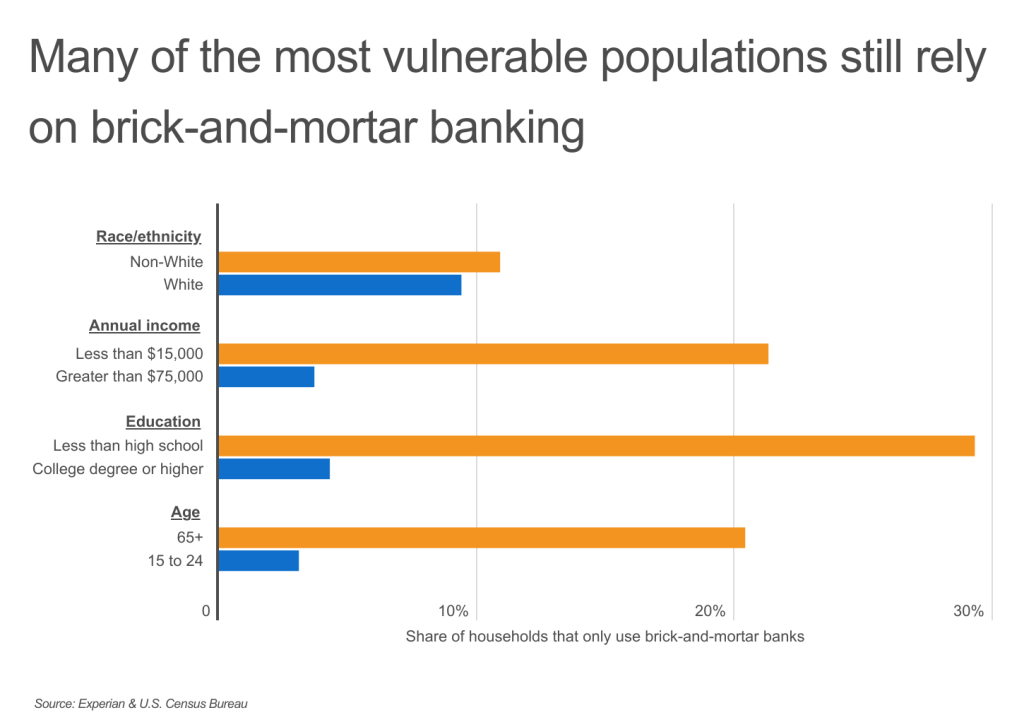
Although online banking has provided a new level of convenience for banking customers, many of the most vulnerable populations still rely on brick-and-mortar locations for their banking needs. In particular, lower-income households (those with less than $15,000 in annual income), households without a high-school degree, and older households are much more likely to rely on brick-and-mortar banks. These households will suffer the most due to the decline in brick-and-mortar bank branches.
Reliance on brick-and-mortar banking also varies by location. States like Oregon, Arizona, and Florida—whose populations include large concentrations of people over 65—are among the states with the most households that use brick-and-mortar banks. Other states, such as North Dakota and Iowa, that have low rates of computer and internet access are also among the states most reliant on traditional banking. Alternatively, Georgia (76.4%), Alaska (76.4%), and Louisiana (76.7%) have the lowest share of households who use brick-and-mortar banks.
To determine the states where people still rely on brick-and-mortar banking services, researchers at Upgraded Points analyzed the latest data from the Federal Deposit Insurance Corporation (FDIC), the National Credit Union Administration, and the U.S. Census Bureau. The researchers ranked states according to the share of households that use brick-and-mortar banks. Researchers also calculated the share of households that only use brick-and-mortar banks, the share of households with a bank account, and the total population per bank branch.
Here are the states where people still rely on brick-and-mortar banks.
States Where People Still Rely on Brick-And-Mortar Banks

Photo Credit: Kit Leong / Shutterstock
15. Oklahoma
- Share of households that use brick-and-mortar banks: 82.8%
- Share of households that only use brick-and-mortar banks: 8.8%
- Share of all households with a bank account: 94.6%
- Total population per bank branch: 2,975

Photo Credit: Henryk Sadura / Shutterstock
14. Florida
- Share of households that use brick-and-mortar banks: 82.9%
- Share of households that only use brick-and-mortar banks: 6.7%
- Share of all households with a bank account: 96.3%
- Total population per bank branch: 4,013

Photo Credit: photo.ua / Shutterstock
13. Colorado
- Share of households that use brick-and-mortar banks: 83.0%
- Share of households that only use brick-and-mortar banks: 7.0%
- Share of all households with a bank account: 94.0%
- Total population per bank branch: 3,518

Photo Credit: Andrey Bayda / Shutterstock
12. Nevada
- Share of households that use brick-and-mortar banks: 83.5%
- Share of households that only use brick-and-mortar banks: 9.3%
- Share of all households with a bank account: 94.4%
- Total population per bank branch: 5,696

Photo Credit: Bogdan Vacarciuc / Shutterstock
11. California
- Share of households that use brick-and-mortar banks: 83.6%
- Share of households that only use brick-and-mortar banks: 9.5%
- Share of all households with a bank account: 95.0%
- Total population per bank branch: 5,134

Photo Credit: Charles Knowles / Shutterstock
10. Idaho
- Share of households that use brick-and-mortar banks: 83.7%
- Share of households that only use brick-and-mortar banks: 8.7%
- Share of all households with a bank account: 97.0%
- Total population per bank branch: 2,867

Photo Credit: Harold Stiver / Shutterstock
9. Kentucky
- Share of households that use brick-and-mortar banks: 83.8%
- Share of households that only use brick-and-mortar banks: 9.9%
- Share of all households with a bank account: 94.8%
- Total population per bank branch: 2,750

Photo Credit: Checubus / Shutterstock
8. Minnesota
- Share of households that use brick-and-mortar banks: 83.8%
- Share of households that only use brick-and-mortar banks: 5.9%
- Share of all households with a bank account: 97.6%
- Total population per bank branch: 3,299

Photo Credit: Gregory E. Clifford / Shutterstock
7. Arizona
- Share of households that use brick-and-mortar banks: 84.4%
- Share of households that only use brick-and-mortar banks: 5.5%
- Share of all households with a bank account: 96.4%
- Total population per bank branch: 5,479

Photo Credit: marchello74 / Shutterstock
6. Illinois
- Share of households that use brick-and-mortar banks: 84.4%
- Share of households that only use brick-and-mortar banks: 8.3%
- Share of all households with a bank account: 95.6%
- Total population per bank branch: 3,172
Photo Credit: Jacob Boomsma / Shutterstock
5. North Dakota
- Share of households that use brick-and-mortar banks: 84.5%
- Share of households that only use brick-and-mortar banks: 8.8%
- Share of all households with a bank account: 96.8%
- Total population per bank branch: 1,734
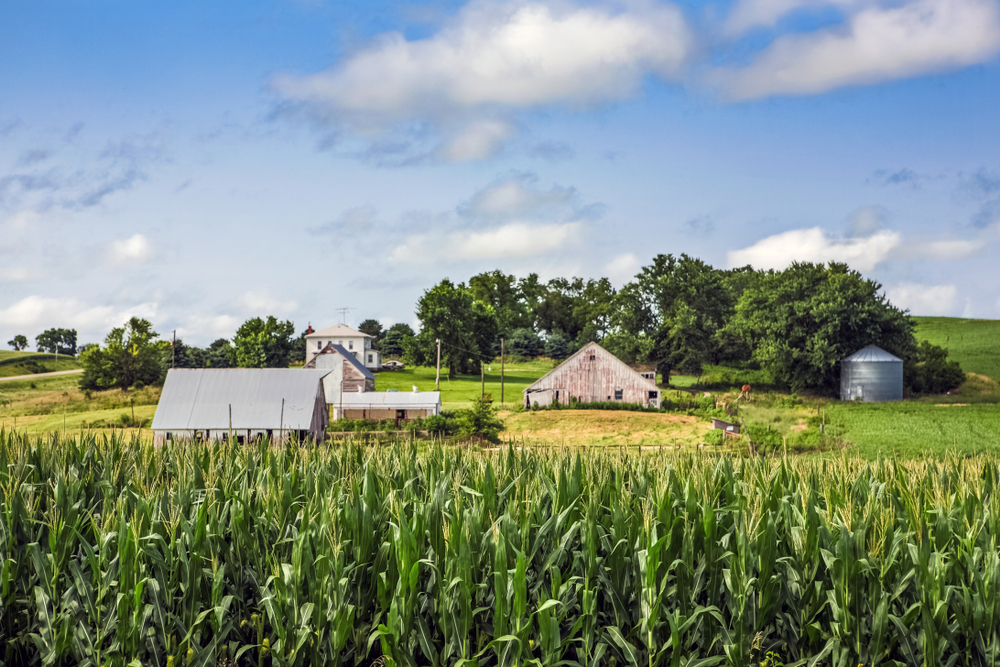
Photo Credit: Suzanne Tucker / Shutterstock
4. Iowa
- Share of households that use brick-and-mortar banks: 85.1%
- Share of households that only use brick-and-mortar banks: 9.6%
- Share of all households with a bank account: 97.0%
- Total population per bank branch: 2,105

Photo Credit: Sean Pavone / Shutterstock
3. Kansas
- Share of households that use brick-and-mortar banks: 85.2%
- Share of households that only use brick-and-mortar banks: 6.6%
- Share of all households with a bank account: 96.2%
- Total population per bank branch: 2,174

Photo Credit: Andrew Zarivny / Shutterstock
2. Utah
- Share of households that use brick-and-mortar banks: 85.3%
- Share of households that only use brick-and-mortar banks: 3.3%
- Share of all households with a bank account: 98.8%
- Total population per bank branch: 3,514

Photo Credit: ESB Professional / Shutterstock
1. Oregon
- Share of households that use brick-and-mortar banks: 88.0%
- Share of households that only use brick-and-mortar banks: 5.2%
- Share of all households with a bank account: 98.4%
- Total population per bank branch: 3,708
Detailed Findings & Methodology
To determine the states where people still rely on brick-and-mortar banking services, researchers at Upgraded Points analyzed the latest data from the Federal Deposit Insurance Corporation’s 2021 National Survey of Unbanked and Underbanked Households, the National Credit Union Administration’s December 2021 Call Report Quarterly Data, and the U.S. Census Bureau’s 2021 American Community Survey. The researchers ranked states according to the share of households that use brick-and-mortar banks, among banked households that accessed their account(s) at least once in the year prior to the survey. In the event of a tie, the state with the larger share of households that only use brick-and-mortar banks was ranked higher. Researchers also calculated the share of households with a bank account and the total population per bank branch. Brick-and-mortar banks include both banks and credit unions.
For complete results for all 50 states, see States Where People Still Rely on Brick-And-Mortar Banking Services on Upgraded Points.