The Millennial generation—those currently aged 27 to 42—is America’s largest, and as they move solidly into their peak earning and spending years, they are quickly asserting their economic power.
Millennials faced a tough economic outlook in their early working years. The impacts of the Great Recession, unprecedented levels of student loan debt, and stagnant wage growth made it difficult to find good jobs and build wealth. But over time, the outlook has improved. Millennials are now the largest segment of the labor force. Within the last few years, they have also become the largest share of homebuyers. And other unique characteristics of the generation—like higher educational attainment levels, especially for women—are contributing to economic advancement as well.
The COVID-19 economy also created some new opportunities for the Millennial generation. Tightness in the labor market for much of the COVID-19 pandemic has allowed many workers to change jobs in the last few years—sometimes multiple times—in search of higher wages or better working conditions. A wave of early retirements among older workers during the pandemic opened up opportunities for younger workers to move into higher-earning roles. And after working remotely during the pandemic, many workers have since successfully pushed for permanent work-from-home or other flexible arrangements that give them more control over where they work.
Because of these trends, the U.S. experienced a sharp rise in the rate of people moving across state lines from densely populated and expensive states to those offering some combination of more affordable housing, more space for home offices, lower taxes, and better recreational opportunities. Such moves were common among wealthy millennial families.

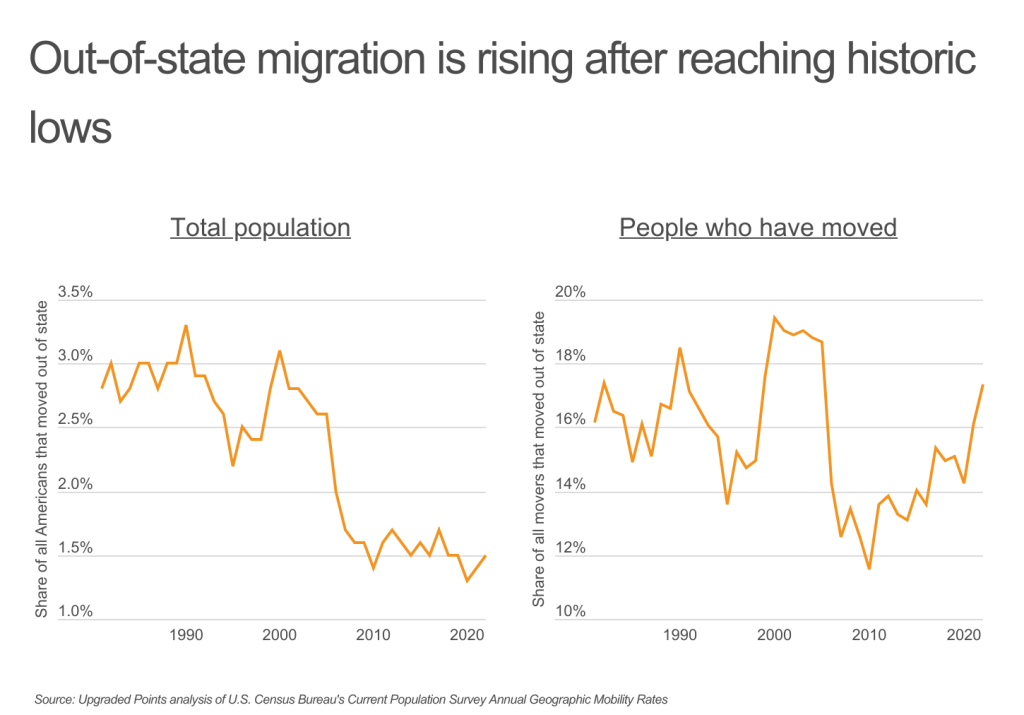
While out-of-state migration as a percentage of total (movers and non-movers) remains near historic lows, out-of-state migration as a percentage of those who moved has increased significantly in recent years. In 2000, nearly one in five movers left one state for another. This rate fell off sharply as the housing bubble burst and the Great Recession set in, making it harder for people to find economic opportunities that justified an interstate move. The out-of-state migration rate fell to a low of 11.5% in 2010, but began to move upward as the economy recovered in the following decade. But in the wake of the COVID-19 pandemic, out-of-state migration has risen sharply, jumping from 14.2% in 2020 to 17.3% in 2022.

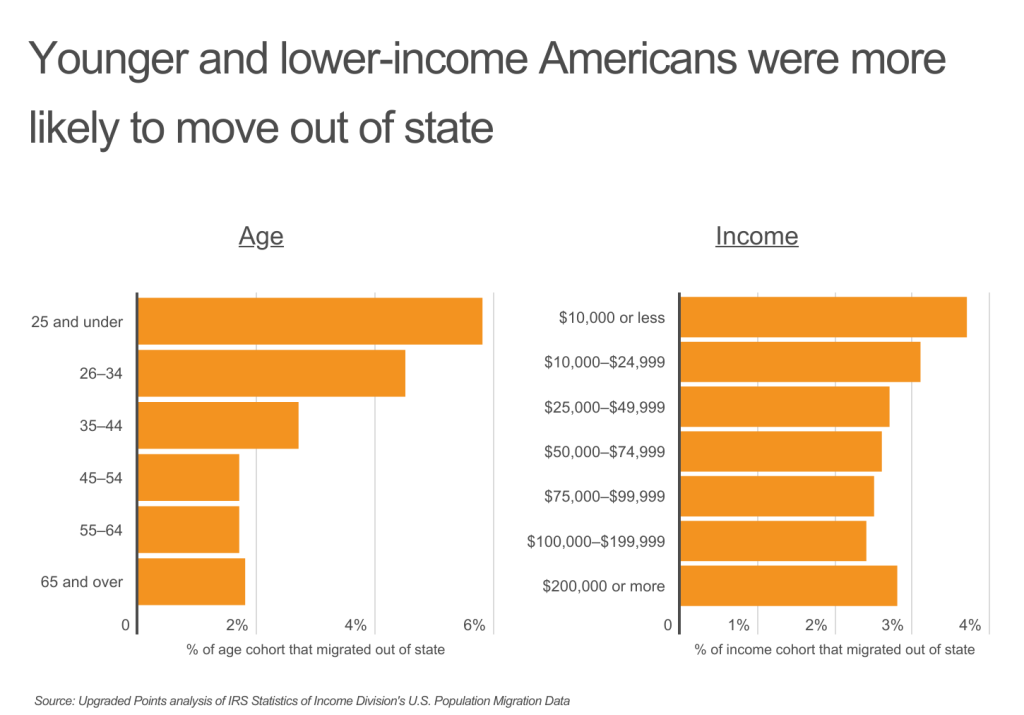
Typically, however, rates of migration are higher during workers’ younger years. Workers have fewer major family or financial obligations at this stage of life, which allows them to be more mobile in pursuing job opportunities. According to individual tax return statistics from the IRS, nearly 6% of those under age 25 moved out of state between 2020 and 2021, as did 4.5% of those aged 26–34 and 2.7% of those aged 35–44. In contrast, fewer than 2% of those in the 45+ age cohorts migrated out of state. Income is also a factor: lower earners tend to move between states at higher rates, with 3.7% of those earning $10,000 or less doing so. The highest earners—those making more than $200,000—also tend to move at a slightly higher rate than most middle-income workers.

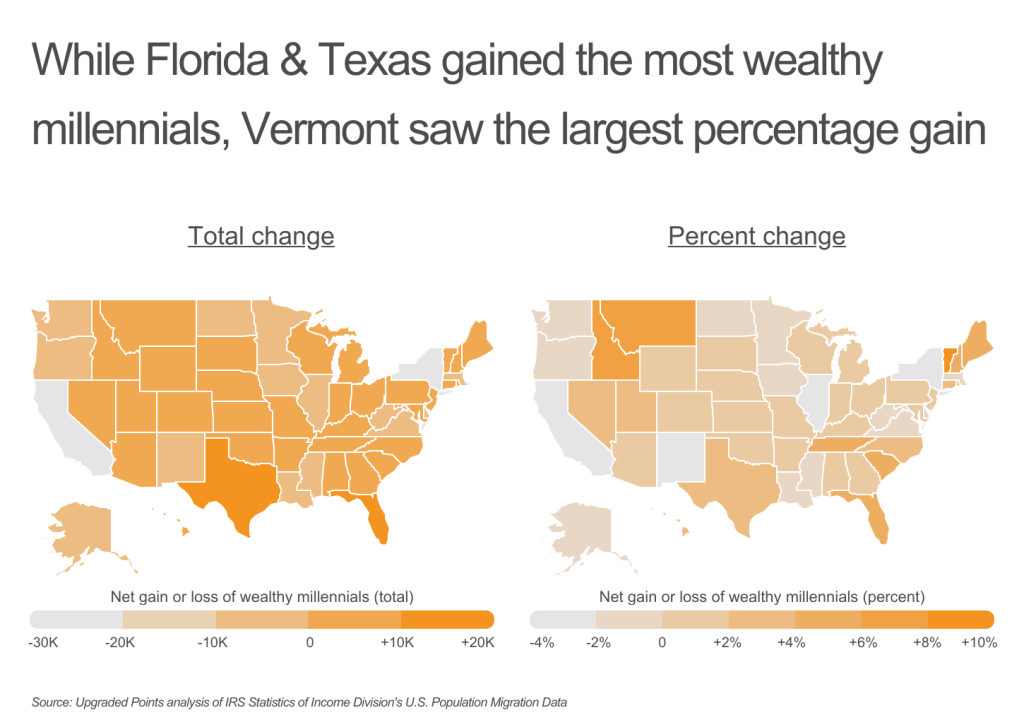
Between COVID-related changes in the labor market and the preexisting tendency of younger and highest-earning workers to be mobile, millennials in the top income brackets have frequently been on the move. In total numbers, Florida and Texas have been the greatest beneficiaries, each adding more than 15,000 millennials who earned more than $200,000 in 2021. California and New York—where high cost of living, especially for housing, is a persistent challenge—fared worst, losing around 31,000 and 27,000 wealthy millennials respectively. On a percentage basis, however, states in New England, the Mountain West, and the Southeast added wealthy millennials the fastest. Vermont (+8.5%) and Maine (+5.5%) led in New England, Idaho (+7.4%) and Montana (+6.7%) in the Mountain West, and Florida (+5.6%) and Tennessee (+4.5%) in the Southeast.
To determine the states attracting the most wealthy millennials, researchers at Upgraded Points analyzed the latest data from the IRS Statistics of Income Division. The researchers ranked locations according to the net inbound migration of wealthy millennials as a percentage of wealthy millennial residents the year prior. For the purposes of this analysis, net gain or loss of wealthy millennials was defined as the difference between those millennials who moved into and those millennials who moved out of a given state based on individual tax return data spanning two years. Additionally, wealthy millennials were defined as those ages 26–45 in the year 2021 who reported earning over $200,000 on their 2021 federal income tax returns. In the event of a tie, the location with the larger net inbound migration of wealthy millennials was ranked higher.
Here are the states attracting the most wealthy millennials.
States Attracting the Most Wealthy Millennials

Photo Credit: Nicholas Courtney / Shutterstock
15. Colorado
- Net gain or loss of wealthy millennials (percent): +1.9%
- Net gain or loss of wealthy millennials (total): +3,359
- Total wealthy millennials who moved in: 10,860
- Total wealthy millennials who moved out: 7,501
- Tax base change from wealthy millennial movers: +$836,819,000

Photo Credit: Sean Pavone / Shutterstock
14. Texas
- Net gain or loss of wealthy millennials (percent): +2.3%
- Net gain or loss of wealthy millennials (total): +15,988
- Total wealthy millennials who moved in: 33,426
- Total wealthy millennials who moved out: 17,438
- Tax base change from wealthy millennial movers: +$3,230,831,000

Photo Credit: f11photo / Shutterstock
13. Utah
- Net gain or loss of wealthy millennials (percent): +2.7%
- Net gain or loss of wealthy millennials (total): +2,850
- Total wealthy millennials who moved in: 5,631
- Total wealthy millennials who moved out: 2,781
- Tax base change from wealthy millennial movers: +$355,977,000

Photo Credit: Sean Pavone / Shutterstock
12. Nevada
- Net gain or loss of wealthy millennials (percent): +2.9%
- Net gain or loss of wealthy millennials (total): +1,196
- Total wealthy millennials who moved in: 3,818
- Total wealthy millennials who moved out: 2,622
- Tax base change from wealthy millennial movers: +$902,050,000

Photo Credit: Sean Pavone / Shutterstock
11. North Carolina
- Net gain or loss of wealthy millennials (percent): +2.9%
- Net gain or loss of wealthy millennials (total): +5,602
- Total wealthy millennials who moved in: 12,326
- Total wealthy millennials who moved out: 6,724
- Tax base change from wealthy millennial movers: +$729,351,000

Photo Credit: Izabela23 / Shutterstock
10. Hawaii
- Net gain or loss of wealthy millennials (percent): +3.0%
- Net gain or loss of wealthy millennials (total): +561
- Total wealthy millennials who moved in: 1,857
- Total wealthy millennials who moved out: 1,296
- Tax base change from wealthy millennial movers: +$160,624,000

Photo Credit: Jon Bilous / Shutterstock
9. Connecticut
- Net gain or loss of wealthy millennials (percent): +3.3%
- Net gain or loss of wealthy millennials (total): +3,795
- Total wealthy millennials who moved in: 8,719
- Total wealthy millennials who moved out: 4,924
- Tax base change from wealthy millennial movers: +$887,761,000

Photo Credit: f11photo / Shutterstock
8. South Carolina
- Net gain or loss of wealthy millennials (percent): +4.3%
- Net gain or loss of wealthy millennials (total): +2,957
- Total wealthy millennials who moved in: 5,546
- Total wealthy millennials who moved out: 2,589
- Tax base change from wealthy millennial movers: +$365,300,000

Photo Credit: Jon Bilous / Shutterstock
7. New Hampshire
- Net gain or loss of wealthy millennials (percent): +4.4%
- Net gain or loss of wealthy millennials (total): +1,434
- Total wealthy millennials who moved in: 2,676
- Total wealthy millennials who moved out: 1,242
- Tax base change from wealthy millennial movers: +$229,277,000

Photo Credit: Sean Pavone / Shutterstock
6. Tennessee
- Net gain or loss of wealthy millennials (percent): +4.5%
- Net gain or loss of wealthy millennials (total): +4,742
- Total wealthy millennials who moved in: 8,364
- Total wealthy millennials who moved out: 3,622
- Tax base change from wealthy millennial movers: +$986,881,000

Photo Credit: Sean Pavone / Shutterstock
5. Maine
- Net gain or loss of wealthy millennials (percent): +5.5%
- Net gain or loss of wealthy millennials (total): +926
- Total wealthy millennials who moved in: 1,580
- Total wealthy millennials who moved out: 654
- Tax base change from wealthy millennial movers: +$139,638,000

Photo Credit: Henryk Sadura / Shutterstock
4. Florida
- Net gain or loss of wealthy millennials (percent): +5.6%
- Net gain or loss of wealthy millennials (total): +16,946
- Total wealthy millennials who moved in: 26,860
- Total wealthy millennials who moved out: 9,914
- Tax base change from wealthy millennial movers: +$6,919,040,000

Photo Credit: Mihai Andritoiu / Shutterstock
3. Montana
- Net gain or loss of wealthy millennials (percent): +6.7%
- Net gain or loss of wealthy millennials (total): +1,160
- Total wealthy millennials who moved in: 1,719
- Total wealthy millennials who moved out: 559
- Tax base change from wealthy millennial movers: +$204,212,000

Photo Credit: Sean Pavone / Shutterstock
2. Idaho
- Net gain or loss of wealthy millennials (percent): +7.4%
- Net gain or loss of wealthy millennials (total): +2,563
- Total wealthy millennials who moved in: 3,738
- Total wealthy millennials who moved out: 1,175
- Tax base change from wealthy millennial movers: +$228,880,000

Photo Credit: Sean Pavone / Shutterstock
1. Vermont
- Net gain or loss of wealthy millennials (percent): +8.5%
- Net gain or loss of wealthy millennials (total): +716
- Total wealthy millennials who moved in: 1,130
- Total wealthy millennials who moved out: 414
- Tax base change from wealthy millennial movers: +$124,231,000
Detailed Findings & Methodology
To determine the states attracting the most wealthy millennials, researchers at Upgraded Points analyzed the latest data from the IRS Statistics of Income Division’s 2021 U.S. Population Migration Data. The researchers ranked locations according to the net inbound migration of wealthy millennials as a percentage of wealthy millennial residents the year prior. For the purposes of this analysis, net gain or loss of wealthy millennials was defined as the difference between those millennials who moved into and those millennials who moved out of a given state based on individual tax return data spanning two years. Additionally, wealthy millennials were defined as those ages 26–45 in the year 2021 who reported earning over $200,000 on their 2021 federal income tax returns. In the event of a tie, the location with the larger net inbound migration of wealthy millennials was ranked higher.
For complete results, see The States Attracting the Most Wealthy Millennials on Upgraded Points.
