
With Thanksgiving and the winter holidays around the corner, nonprofits and charitable organizations are readying themselves for “Giving Season”—one of the busiest times of year for charities in the U.S.
The season kicks off with ”Giving Tuesday” and runs through December 31st. According to Network for Good, 30% of all annual nonprofit giving takes place during this time. No matter the mission, issue area, or geographic focus, Giving Season represents one of the prime occasions to support nonprofit organizations. It is also when the nation’s most charitable cities—those that have the highest percentage of taxpayers donating to charity—are most active.
Charitable Giving by Income Level
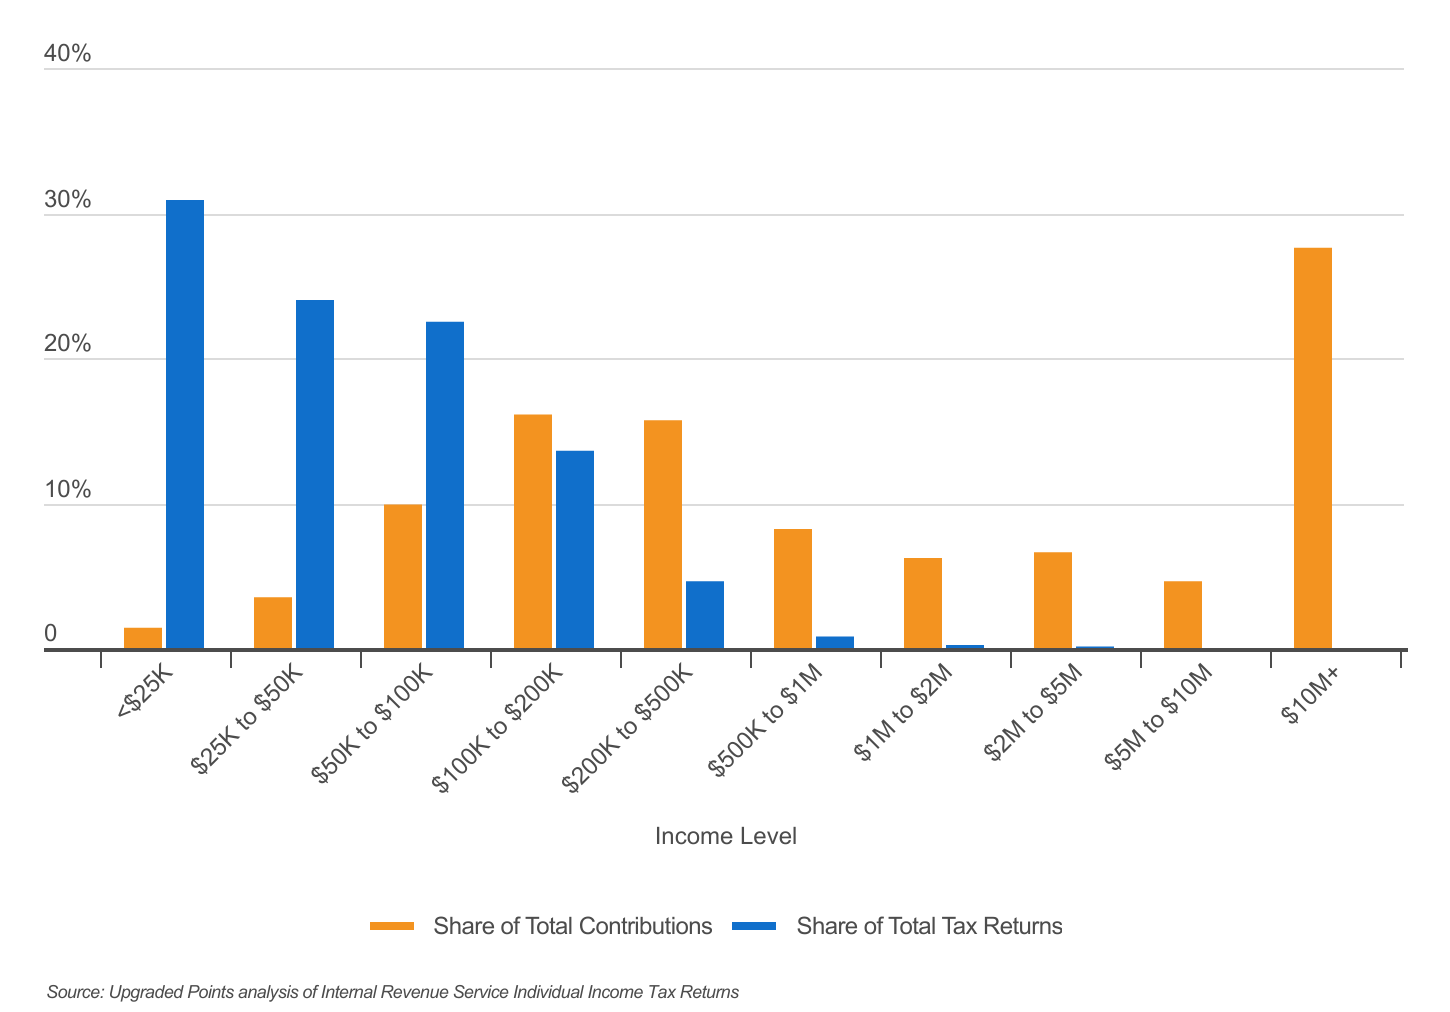
More than half of charitable contributions are made by the top 1% of earners. Image Credit: Upgraded Points
While charitable organizations can raise funds through grants, events, and earned income, individual donations are a critical component of most nonprofits’ revenue mix. According to individual tax return data from the IRS, Americans donate more than $215 billion to charitable causes each year—with a disproportionate amount coming from certain segments of the population.
The largest share of total contributions comes from the country’s highest earners. Ultra-high earners—who bring in more than $10 million annually—donate nearly $60 billion per year in total. This figure represents more than a quarter of all contributions, despite the cohort representing less than 0.02% of all tax returns. Collectively, more than half of all charitable contributions are made by the top 1% of earners.
Charitable Giving by State
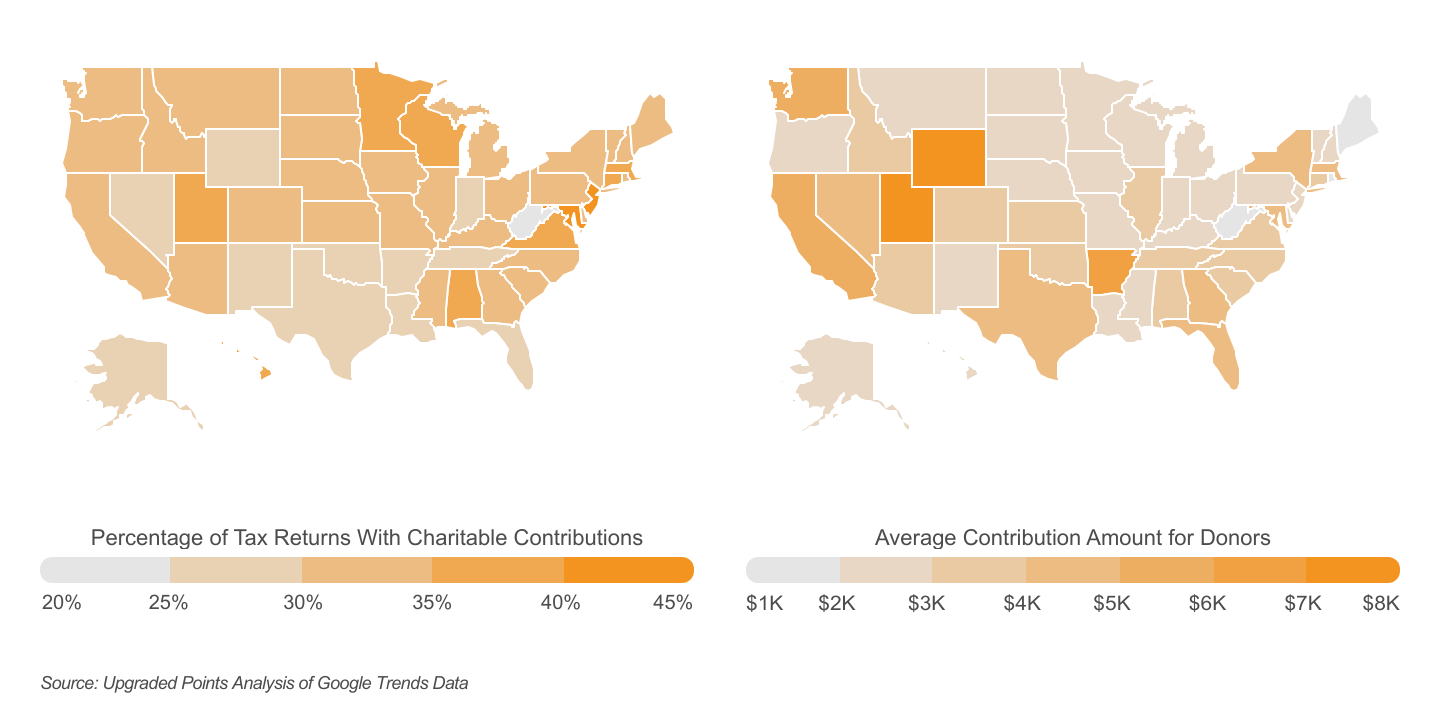
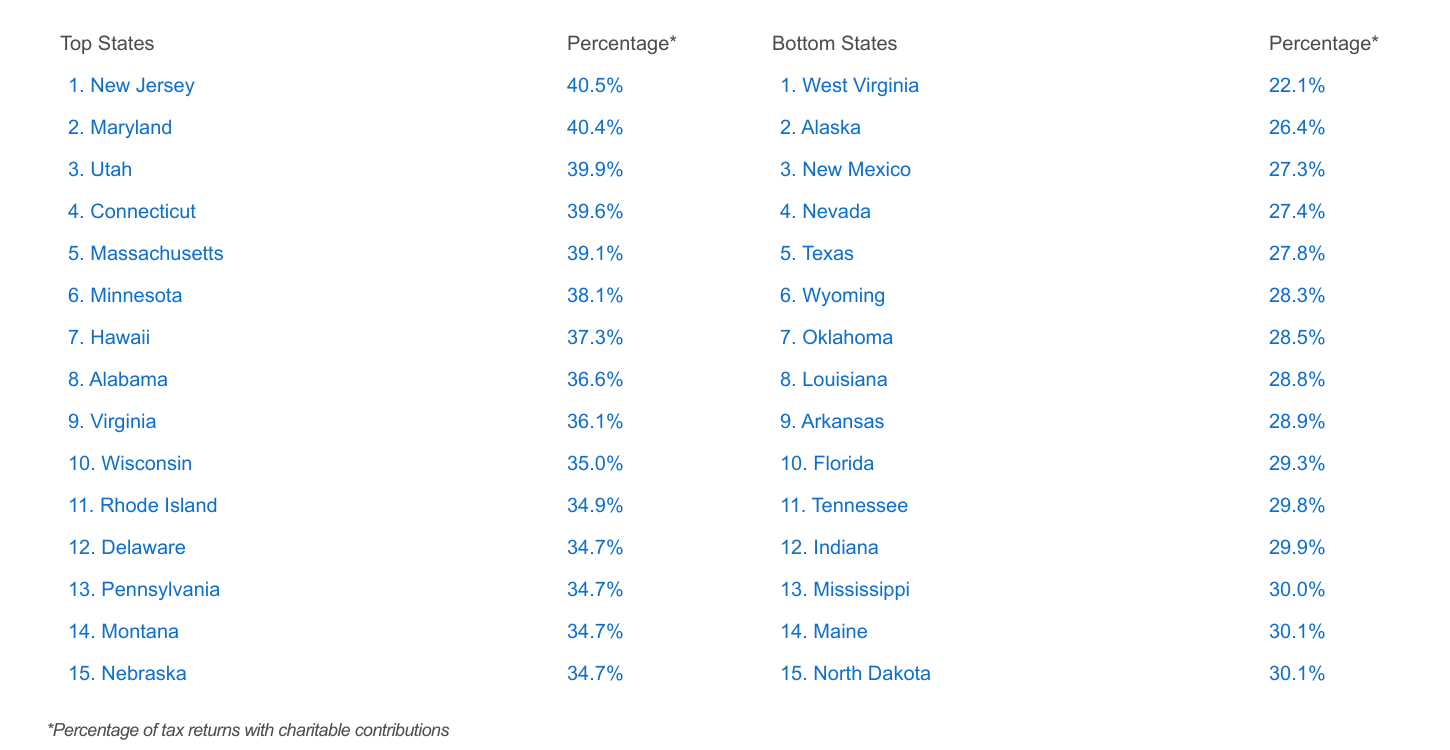
Select Northeast states & Utah report the highest rates of charitable giving. Image Credit: Upgraded Points
Charitable giving also varies widely by geography in the U.S. Many of the states with the greatest share of donors are found in the Northeast, which includes states where earning levels are relatively high. In Maryland and New Jersey, more than 40% of tax filers report charitable contributions, with residents of Connecticut and Massachusetts reporting donations on 39.6% and 39.1% of returns, respectively.
Another standout is Utah, where 39.9% of tax returns include donations, and where the average donation of $7,041 was the second-highest among all states. Utahns’ generosity is likely tied to the state’s highly religious Latter-day Saints population.
Interestingly, some states have relatively low levels of charitable activity but higher contributions among those who do donate. Wyoming has the nation’s largest average donation at $7,995 despite ranking 45th by share of returns with charitable contributions. Similarly, Arkansas—notably home to the Walton family—has the third-largest average contribution at $6,021 but ranks 42nd by share of contributions.
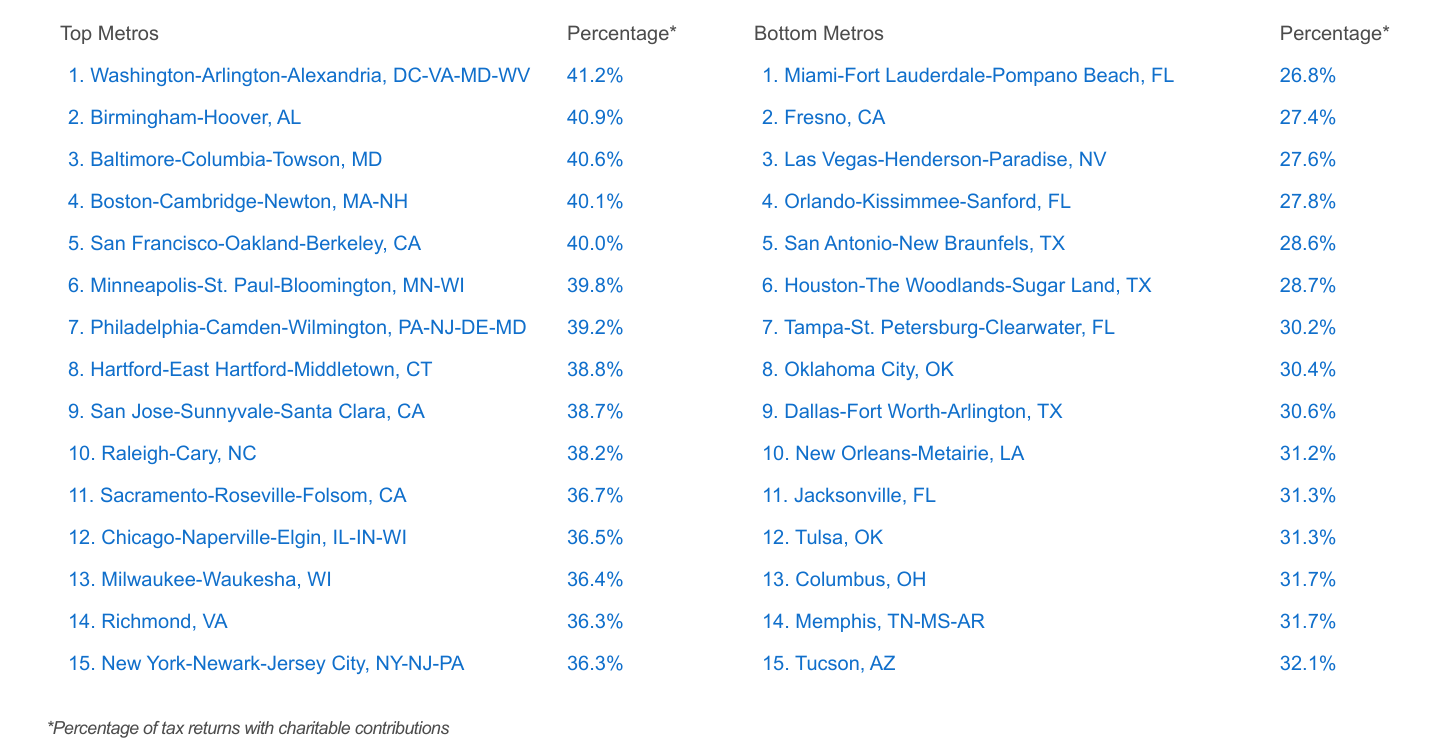
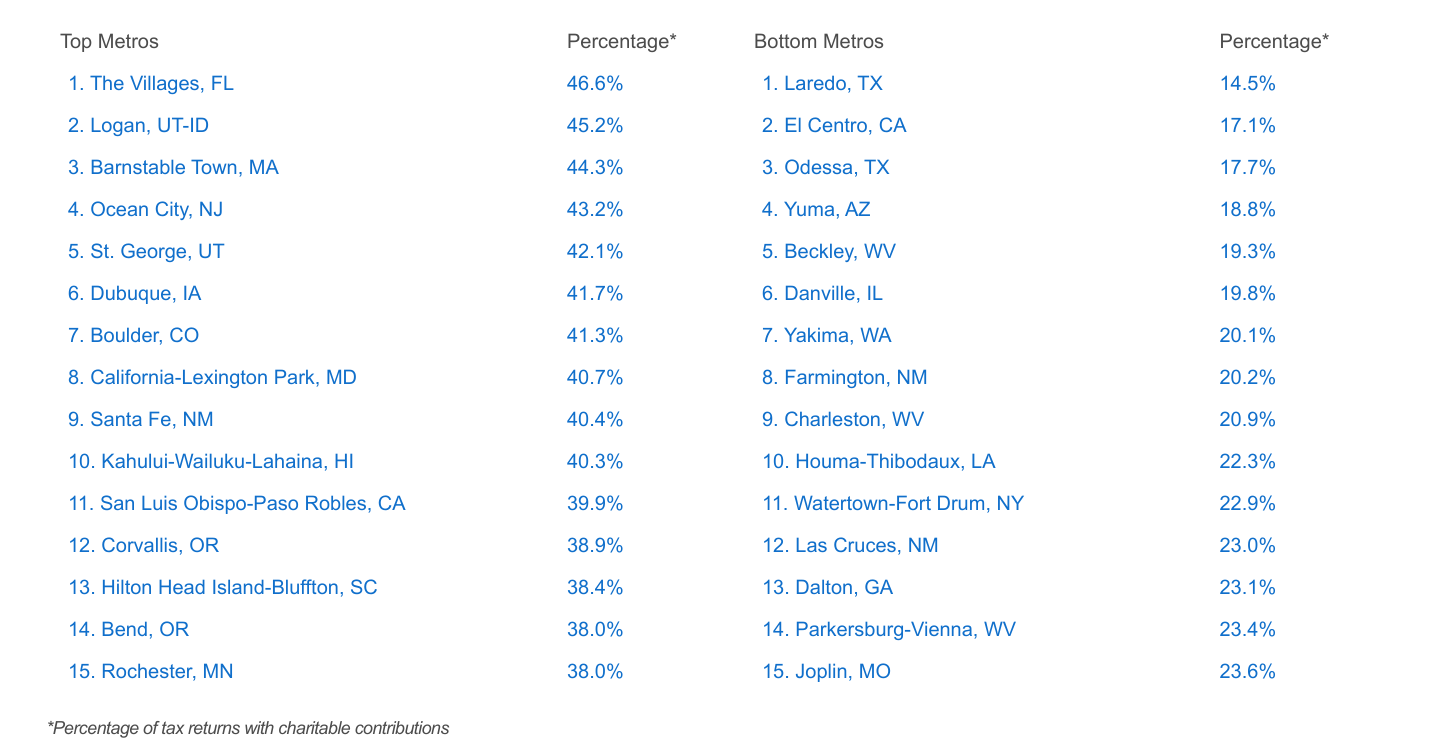
At the local level, rates of charitable giving are also well correlated with income levels. While 32.9% of taxpayers report charitable donations nationally, that rate exceeds 40% in affluent metropolitan areas like Washington, D.C., Boston, and San Francisco. However, two of the top three metropolitan areas overall for rates of charitable giving are located in Utah: Provo-Orem (48.6%) and Logan (45.2%). On the other end of the spectrum, large metro areas like Miami, FL (26.8%), Fresno, CA (27.4%), and Las Vegas, NV (27.6%) have the lowest proportion of tax returns with charitable contributions.
Below is a complete breakdown of all U.S. metropolitan areas (grouped by size) and states ranked by the percentage of taxpayers who report charitable contributions. The analysis was conducted by Upgraded Points using individual income tax return statistics from the IRS.
Upgraded Points performed the analysis using the IRS’s latest individual income tax return statistics, covering tax year 2020. This year proved especially valuable for studying charitable contributions due to a temporary COVID-19 provision that allowed taxpayers taking the standard deduction to still deduct cash donations made to charity on their returns. The change provides previously unavailable visibility into giving patterns of the nearly 90% of filers who don’t itemize.
Most and Least Charitable Large Metros
Most and Least Charitable Midsize Metros
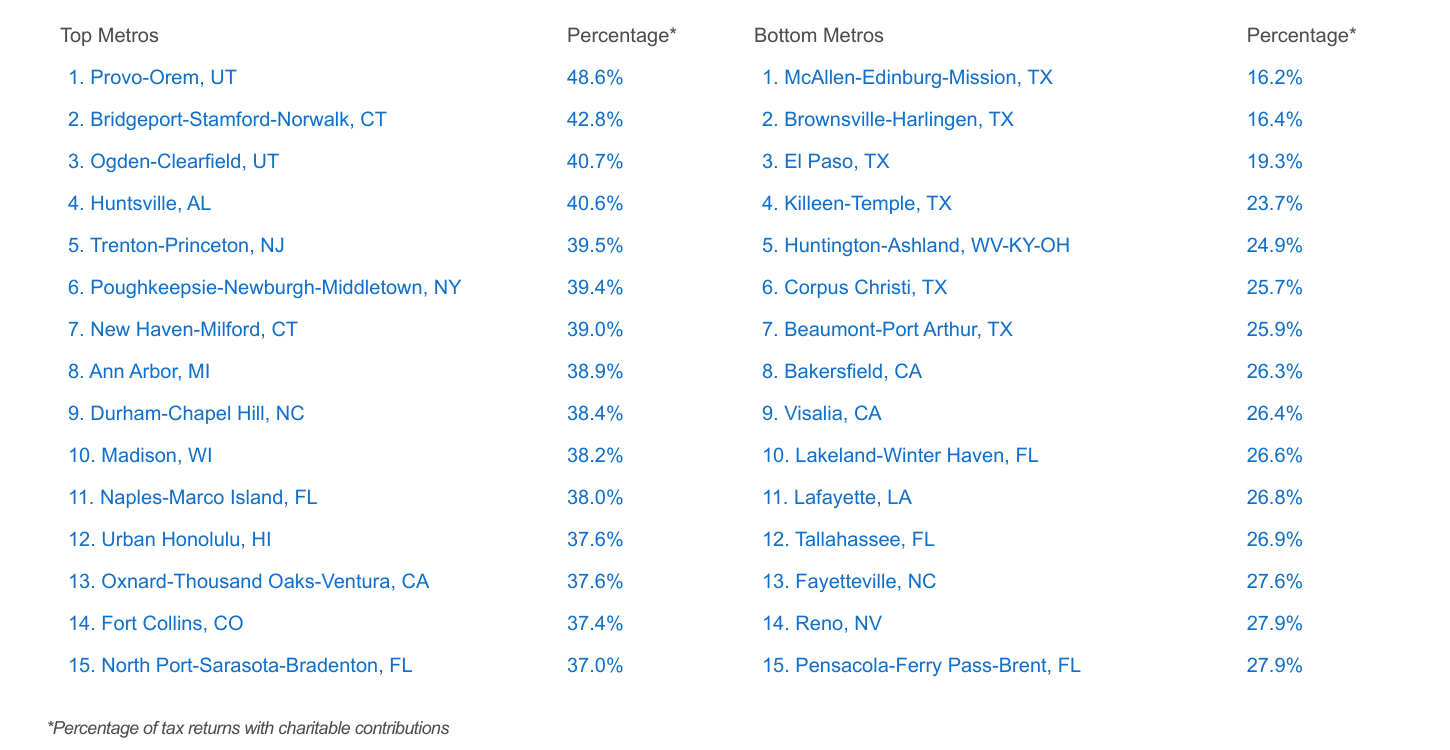
Most and Least Charitable Small Metros
Most and Least Charitable States
Methodology

The data used in this analysis is from the Internal Revenue Service (IRS) 2020 Individual Income Tax Return Form 1040 data series. To determine the most charitable locations in the U.S., researchers at Upgraded Points calculated the percentage of tax returns with charitable contributions—including those tax returns where individuals took the standard deduction and those where deductions were itemized. In the event of a tie, the location with the greater amount of charitable contributions relative to total adjusted gross income was ranked higher. Researchers also calculated the average contribution amount, which was calculated as total charitable contributions divided by total tax returns with charitable contributions. To improve relevance, metropolitan areas were grouped into cohorts based on population: small (<350,000), midsize (350,000–999,999), and large (1,000,000+).
For complete results, see The Most Charitable American Cities on Upgraded Points.